Is The Bull Trap Complete?

Some of you may be old enough to remember when Desert Storm started in January 1991. The news of this war took the US and the world by storm – almost literally. It was televised and it changed the way people lived their lives at that time. People were almost glued to the TV watching the videos and satellite feeds. It turned into the ultimate reality TV series – must-see TV.

The US markets reacted to this foreign engagement. At first, the markets rallied for about 7+ weeks in early 1991, then they started to consolidate below resistance. For many people and businesses, this new reality event presented very real challenges for revenues and growth. Many businesses were forced to close because of the sudden shift in consumer activity and concerns. The reason I’m bringing this up right now is that I believe we are experiencing a new type of “reality event” (actually events) that has transitioned to become a driving force in the markets, namely COVID and the protests/riots in many cities across the US.

Chaos & Disease – The Ultimate Distractions

With the US Presidential Election only about 60+ days away and winter fast approaching, the US has a number of fundamental issues to contend with going forward. What happens if the US elections are contested in the courts? What happens to policy and the support for the consumer/markets when the US government potentially enters this chaotic phase? What happens when winter hits and businesses that have been struggling through the warm summer months suddenly find themselves losing more revenues and customers? What happens if the streets remain in a state of unrest throughout the rest of this year and into next year? Continue reading "Is The Bull Trap Complete?"

Precious Metals Warn Of Increased Volatility

Are the precious metals patterns predicting a big downside price event?

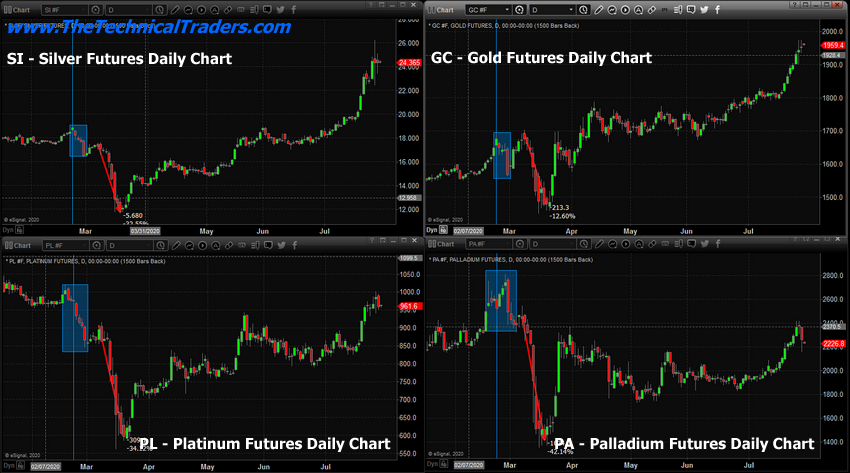
Our trading team witnessed a big drop in Platinum and Palladium prices early this morning while Gold and Silver continued to push moderately higher. We began to question this move and investigate any historical relevance to previous patterns. Our research team pointed out that both Platinum and Palladium rolled lower just 3 to 4 days before the breakdown in the US stock markets on February 24, 2020, while Gold and Silver were reaching recent price peaks. Could the patterns in precious metals be a warning of another potential volatility spike and price decline in the near future?

Our research team created the charts below to help highlight the pattern that we are seeing in Precious Metals right now. First, we highlighted February 24, 2020, with a light blue vertical line to more clearly illustrate where the markets initiated the COVID-19 breakdown event. Next, we drew shaded rectangles around new downside price rotation levels that took place near this peak in the US stock markets. Lastly, we drew a red line that highlights the subsequent price decline that took place in Precious Metals as the markets tanked in late February and early March 2020.

Precious Metals

The current downside price move in Platinum and Palladium are very interesting because it appears Platinum and Palladium both initiated a downside/contraction price event just 3 to 4 days before Gold and Silver, as well as the rest of the US stock market, began to collapse on February 25, 2020. You can clearly see in the bottom two charts that Platinum and Palladium initiated a downside price correction a few days before both Gold and Silver reached their peak levels and began to move lower. Once this peak rotation took place, all four of the major metals groups moved moderately lower for about 7 days before pausing, then collapsed even further. Continue reading "Precious Metals Warn Of Increased Volatility"

Silver Begins Big Upside Rally Attempt

The move we saw in Silver early this week to new 6-year high price levels, above $22.60, is quite likely the biggest upside move in Silver since the bottom in March 2020 – after the US stock market collapsed because of the COVID-19 virus event. This new rally in Silver is likely the move we’ve been suggesting to our followers relating to a series of measured upside price moves totaling approximately $5.30 in each advance.

As traders, watching bonds accelerate moderately higher as the US Dollar falls and the stock market attempts new lofty levels, we are intrigued by the move in metals because it suggests a large segment of investors believe a bubble is nearing very peak valuation levels. The only reason metals, particularly Silver, would be accelerating as it has recently is that traders have suddenly adopted a stronger demand for second-stage hedging of risk.

Gold is the traditional hedge for many traders in times of risk. Silver, being the second-tier hedge, typically start to rally 4 to 6+ months after Gold begins to move substantially higher. Gold is currently trading near all-time highs – near $1820. Silver just recently bottomed in March 2020 near $11.65 and has rallied more than 70% to current levels – above $20.35. If our research is correct, Silver will rally to levels above $26 within this current upside rally.

The multiple measured moves in Gold and Silver suggest waves of price advances happen in a series of structured upside price moves. We believe this current upside move in Silver will push price levels above $26 per ounce. If Gold continues to rally as Silver rallies, then future measured moves should target $31.50 and $36.75 in Silver – possibly higher. Continue reading "Silver Begins Big Upside Rally Attempt"

Financial Sector ETF May Break Below Price Gap

Our research team warned of a peak in the Financial Sector ETF on June 10, 2020, with this article.

It was important to understand the technical setup that existed at that time and what the Fibonacci Price Modeling system was showing then. There was very clear support near $23 that was highlighted by the Fibonacci Price Modeling System, and we were very clear in our future price predictions within that article.

"The $27 price peak sets up directly between our two Fibonacci Daily upside price target (Peak) levels. We believe this setup is a very strong indication that a move to below $23 may be setting up over the next 30+ days. The Q2 data may very well push investors to re-evaluate the potential for the Financial sector if delinquencies and at-risk borrowers continue to default in greater numbers."

The timing of our original article could not have been better for skilled technical traders. Since that June 10, 2020 article posted, the XLF price has fallen almost exactly to $23 (-10.15%).

Currently, the FLX price is recovering just above the price gap that will act as the next "window" for the price to attempt to fill. Skilled technical traders should watch Continue reading "Financial Sector ETF May Break Below Price Gap"

Election Year Cycles - What To Expect

Every election year over the past five US Presidential election cycles has presented a unique set of price rotation events. Particularly evident in strongly contested US Presidential candidate battles where the voters are consumed with pre-election rhetoric. The 2007-08 election cycle was, in our opinion, very similar to the current market cycle in terms of consumer sentiment and economic function. The 2015-16 election cycle was less similar, yet still important for our researchers.

The economic conditions of the US economy and the global economy were vastly different prior to each US Presidential election cycle and continue to evolve throughout the current 2020 election cycle. Yet, our researchers believe the correlation of price volatility and rotation combined with the distraction for consumers as the election process occupies the hearts and minds of almost everyone across the globe takes a toll on the markets. Prior to almost any US Presidential, price volatility and trends tend to become much more exaggerated and extended.

We’ve published research articles about this technical setup/pattern that occurs in the markets nearly 8 to 15+ months before the US Presidential election cycle before. The basic theory of the setup/pattern is as follows…

  • 12+ months prior to the election date, the parties consolidate around specific candidates where the first battles of the US presidential election cycle conclude.
  • Over the next 12 months, the battle between the selected candidates becomes more heated and aggressive as voters are pushed information and disinformation related to their decisions.
  • The process of the election and the decision-making process for consumers/voters is very stressful and distracts from the normal economic activity for many. This distraction translates into an indecisive market where future expectations (optimism and pessimism) greatly depend on the outcome of the election. Thus, the markets are stuck in a “no man’s land” type of “stasis” waiting for the election event to conclude.

Depending on the events that lead up to the election date, the stock market could be biased towards a bullish trend or a bearish trend which can have a big impact on the pre and post-election outcomes.

S&P 500 Index 2006-09 US Presidential Election Cycle

Let's start by taking a look at the 2006-09 (2008 US election cycle) data/chart. Continue reading "Election Year Cycles - What To Expect"