Will 2021 Prompt A Big Rotation In Sector Trends?

An interesting question was brought to my research team recently related to sector trends in 2021 and what may shift over the next 10 to 12+ months. We took the effort to consider this question and to consider where trends may change over time.

The one thing my research team and I kept returning to is “how will the global economy function after COVID and how much will we return to normalcy over the next 12 to 24+ months?”

We believe this key question will potentially drive sector trends and expectations in the future.

When COVID-19 hit the globe, in early 2020, a forced transition of working from home and general panic took hold of the general public. Those individuals that were able to continue earning while making this transition moved into a “protectionist mode” of stocking, securing, preparing for, and isolating away from risks. This shift in our economy set up a trend where certain sectors would see benefits of this trend where others would see their economies destroyed. For example, commercial real estate is one sector that has continued to experience extreme downside expectations while technology and Healthcare experienced greater upside expectations.

Longer-Term Sector Trends– What's Next?

When we look at a broad, longer-term, perspective of market sectors, we can see how many sectors have rallied, some are relatively flat, and others are still moderately weak compared to pre-COVID-19 levels. The top row of these charts, the $SPX (S&P500), XLY (Discretionary), XLC (Comm Services), and XLK (Technology) sectors have all shown tremendous rallies after the COVID-19 lows in March 2020. We can also see that XLI (Industrials), XLB (Materials), and XLV (Healthcare) have all started to move higher recently. Continue reading "Will 2021 Prompt A Big Rotation In Sector Trends?"

Treasury Yields Suggest A Top Is Near

Historically, whenever the Treasury Yields fall below zero, then recover back above zero, the US/Global markets reach some peak in price levels within 3 to 8+ months. My research team and I believe the actions of the global markets may be setting up for a future peak in price levels sometime in the next 6 months. We believe this will start when the Treasury Yields cross above the “Breakdown Threshold”.

Expect a continued rally as long as yields stay below certain levels.

In 1998, a very brief drop below zero in yields prompted a minor pullback in the markets before the bigger top setup in 2000. This pullback in price aligned with what we are calling the “Breakdown Threshold” level on Yields near 1.20. After the Yields crossed this Threshold, briefly, in 1999, they fell back below this level and the US stock market continued to rally toward an ultimate peak in 2000.

In late 2000, Yields collapsed well below the zero levels and recovered back above zero in early 2001. Just 3+ months later, Yields had rallied above the Breakdown Threshold level (1.2) and the US stock markets had already begun to breakdown as well. This instance, the 2000-01 peak, took place after an Appreciation cycle phase prompted an Excess Phase Rally (the DOT COM bubble). The “Rollover Top” that took place near this top may be similar to what we see happen in 2021 if our research is correct. Continue reading "Treasury Yields Suggest A Top Is Near"

U.S. Stock Market Rolls Lower

Stock market price action is usually conducted in a series of up and down price phases – or waves/cycles. Typically, price will move higher or lower in phases- attempting to trend upward or downward over time. This type of price action is normal. Extended upward trends with very little downward price retracements happen sometimes – but not often. They usually happen in “excess phase” rallies or after some type of news event changes expectations for a symbol/sector.

Putting Concerns Into Perspective – Still Bullish

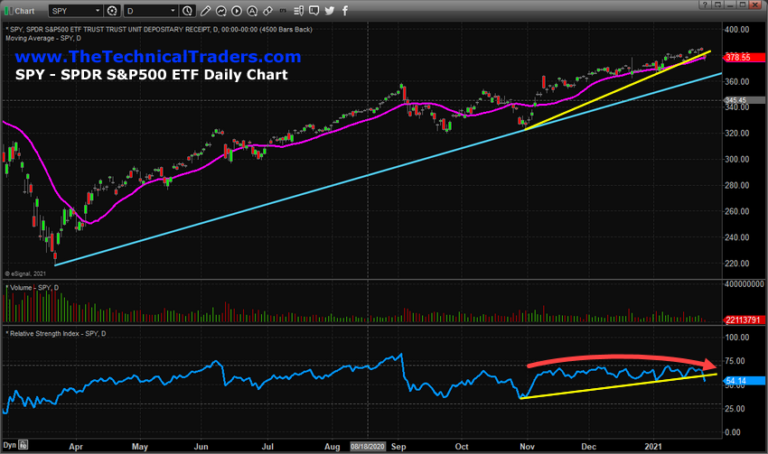
Since early November 2020, the US stock market has continued to rally in a mode that is similar to an excess phase rally – showing very little signs of moderate price rotation. While price volatility has continued to stay higher than normal, you can see from the SPY Daily chart below that it has rallied from $324.40 to $385.95 (over 18%) in just under 90 days. At some point in the future, a moderate price rotation/retracement will happen that may be in excess of 6% to 11% – as has happened in the past.

Stock Market

The purpose of this research post is to alert readers that the markets appear to have started a period of downside price rotation – which is normal. This SPY Daily chart, above, highlights the upward support channel originating from the March 21, 2020, COVID-19 lows (CYAN line) and also the upward support channel originating from the early November 2020 lows (YELLOW line). Continue reading "U.S. Stock Market Rolls Lower"

Custom Valuations Index Suggests Precious Metals Will Decline

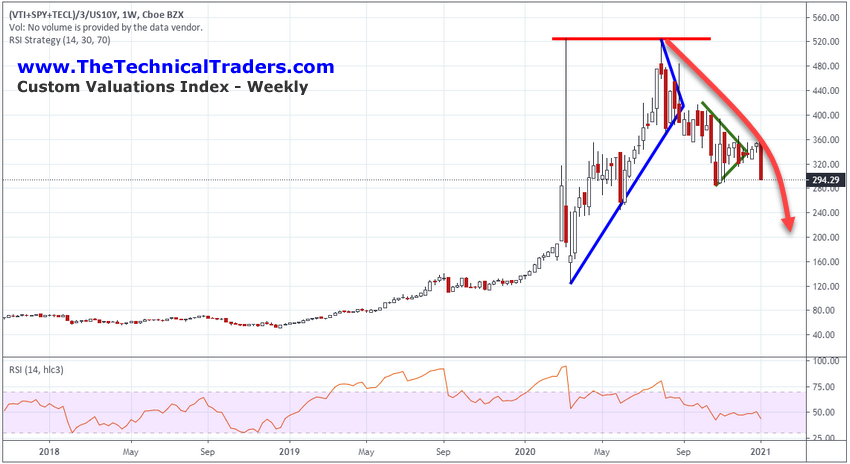
My team prepares Custom Valuations Index charts to understand how capital is being deployed in the global markets alongside US Dollar and Treasury Yields. The purpose of the Custom Index charts in this article is to provide better insight into and understanding of underlying capital movements in various market conditions. Recently, we discovered the Custom Index chart shares a keen alignment with Gold (and likely the general precious metals sector). Let’s explore our recent analysis to help readers understand what to expect next in precious metals.

Weekly Custom Valuations Index Chart

The first thing that caught my attention was the very clear decline in the weekly Custom Valuations Index recently, as can be seen in the chart below. The second peak on the Custom Valuations Index chart occurred on the week of August 3, 2020. Gold also peaked at this very same time. This alignment started an exploratory analysis of the Custom Valuations Index and the potential alignment with the precious metals sector.

Custom Valuations Index

The peak in the Custom Valuations Index on March 20, 2020 (near the height of the COVID-19 market collapse) presented a very clear upside target which was confirmed with a second peak level in August 2020. The fact that the Custom Valuations Index reached that peak level again and that peak level also aligned with the peak price in Gold may just be a coincidence. As we continue to explore this unique alignment, we’ll explore more unique characteristics to see if there is a link that is more than mere chance. Continue reading "Custom Valuations Index Suggests Precious Metals Will Decline"

Will 2021 Be The Year For Cannabis Stocks?

Great progress in terms of legalization was made for the Cannabis/Marijuana sector in 2020 that will. The 2020 elections resulted in a number of US states engaging in new Cannabis friendly policies and laws being approved by voters. This suggests a new rally in the Cannabis sector may be setting up in 2021 and beyond for traders. Our BAN – Best Asset Now – trading strategy is always looking out for the next sector to make a trade, and the Cannabis sector is certainly one we are keeping our eyes on! Make sure you sign up for my FREE webinar to find and trade the Best Assets Now just like me.

Weekly MJ Price Flag Setup

My research and I team believe the recent longer-term bottom in the MJ ETF, the Alternative Harvest ETF, suggests a broad bottom is setting up in the Cannabis/Marijuana sector. If this bottom in the Cannabis sector continues to profit support for the entire sector, then we may see price appreciation across many individual Cannabis stocks over the next 12+ months. Additionally, this price appreciation may prompt quite a bit of consolidation across the entire Cannabis/Marijuana sector.

The global use and demand for CBD & THC related products may continue to expand as medical and personal use expands across the US and into other nations. We are still near the infancy of understanding the true medicinal benefits of this all-natural product. A new upward price trend in this sector may prompt a global expansion/consolidation event where the Cannabis/Marijuana industry attempts to restructure into true global power companies. Continue reading "Will 2021 Be The Year For Cannabis Stocks?"