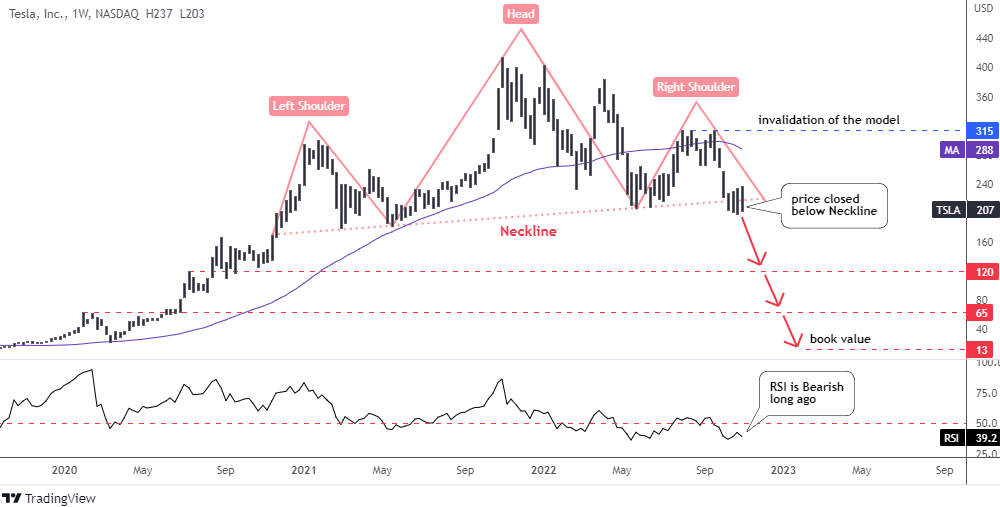
It is good to see a Head and Shoulders pattern in the making and to see it in the final stage is great luck. Fortunately, I spotted one such pattern in the chart of the Tesla (NASDAQ:TSLA)
The stock price of Tesla has been trading in a big range between $180 and $414 after it managed to break above the Y2020 top of $167. Peak points were distributed unevenly as we can see the lower tops on both sides of the all-time high. This has shaped a notorious Head and Shoulders pattern on the weekly chart.
We saw this model in the Ethereum and AMD charts this year.
The model is clear; it has slightly up-sloping angle as the Right Shoulder is located higher than the Left Shoulder. A Neckline has been built through the valleys of the Head. The stock price has been hovering here for some time.
Last week, the market closed below the Neckline triggering the bearish signal.
The target of this pattern is located in the negative numbers area so I skipped it. Instead, I highlighted three potential supports that could stop the upcoming collapse.
The first support is located at the peak of August 2020 at $120. It was broken to the upside and then it was retested by a huge consolidation.
The next support comes from the top of February 2020 at $65. The price has been struggling to overcome it for a long time. The book value level of $13 is the ultimate support based on fundamental data. Continue reading "These Stocks Are Falling Knives"
