Weekly Stock Market Forecast

This week we have a stock market forecast for the week of 4/04/21 from our friend Bo Yoder of the Market Forecasting Academy. Be sure to leave a comment and let us know what you think!

The S&P 500 (SPY)

SPY Daily Chart - Stock Market Forecast

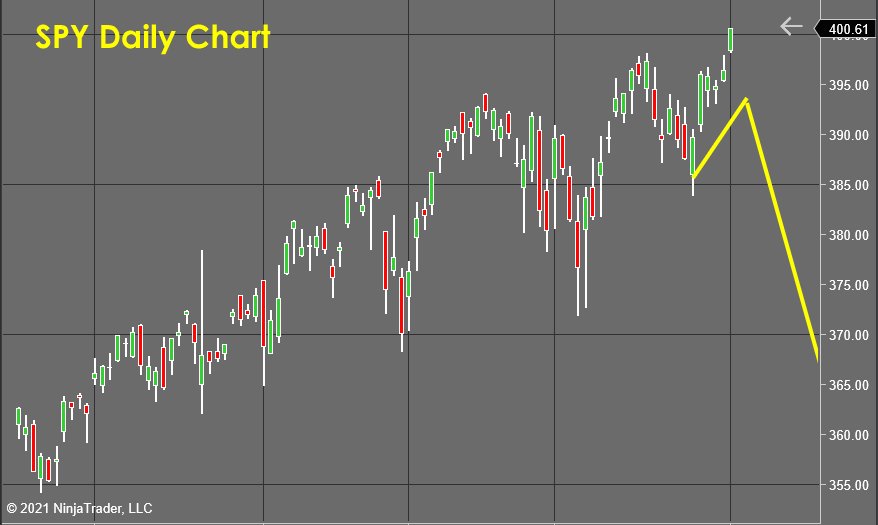
The news of the new infrastructure/stimulus bill caused the market (analyzed here using the SPY) to react with a gap up and run type candlestick. This surge took out the highs since it seems the Fed will accept a period of inflation as all these new print and spend policies work their way through the economy. The Jobs numbers beat expectations as well, and this also pushed stocks higher. However, the buying hasn’t shown to be connected to a new surge in internal bullish energy, so I’m still expecting to see a topping process begin soon.

With this new upthrust in prices, the head and shoulder pattern I was forecasting for this week has invalidated itself, and I’ll wait to see what profit-taking pressures show up next week before figuring out if this breakout is just simply the head of a NEW head and shoulders formation. Continue reading "Weekly Stock Market Forecast"

Weekly Stock Market Forecast

This week we have a stock market forecast for the week of 3/27/21 from our friend Bo Yoder of the Market Forecasting Academy. Be sure to leave a comment and let us know what you think!

The S&P 500 (SPY)

SPY Daily Chart - Stock Market Forecast

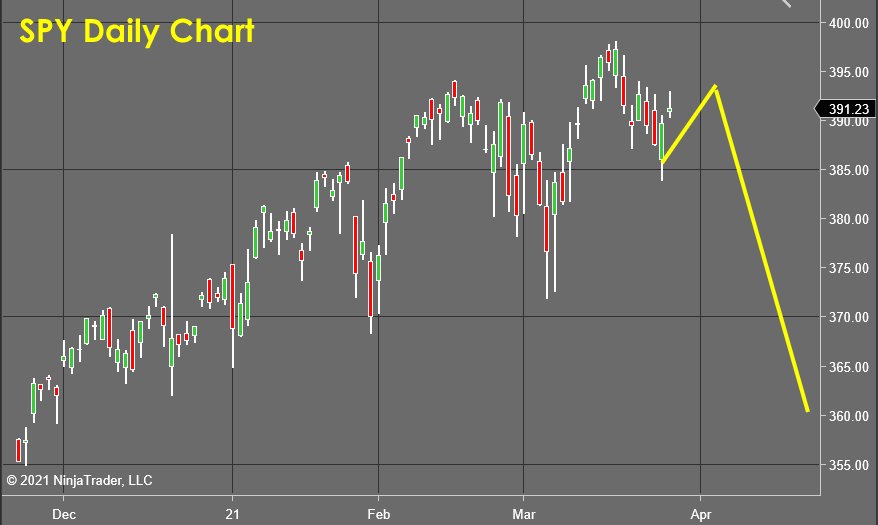
Not a lot has changed in my forecast since last week… I believe the S&P 500 (analyzed here using the ETF SPY) is working its way through a possible head and shoulders reversal pattern on the daily chart. This is a very well understood and recognized reversal pattern and would thus attract a lot of profit-taking activity which I’m expecting to turn the market sharply lower.

For those who are more visual, my forecast for the S&P can be best understood by looking at the yellow lines on the attached chart. The bounce I forecasted last week appeared on schedule and is driving the price up for what I believe will be a failed rally ending as a lower high. Continue reading "Weekly Stock Market Forecast"

Gold Sector Correction Is Maturing

Gold Stock Seasonal Average

The HUI Gold Bugs index has over the last 2 decades (encompassing both bull and bear markets) tended to bottom in July per stockcharts.com's data for the index. A seasonal average is not a directive, but it is a (+/-) guide to be factored. Last year gold stocks bottomed in May as we caught what would be a violent upswing. This year I expect the low to be in June or July.

Why Gold?

As the stock market’s broad relief rally lumbers on, drawing the ire of bears that think it should be otherwise, a chorus of dissenting voices is blaming legions of shut-in Millennials and their Robinhood trading accounts for the excess. Maybe that plays a small part.

But here I’ll repeat that the Fed is balls-out printing money (really funny munny), manipulating Treasury and Corporate bonds and stating that it will have virtually no limits in this MMT (I would turn around MMT to call it what it actually is, TMM or Total Market Manipulation). They can give it a fancy name like Modern Monetary Theory but by any other name, it is chicanery and a scam that society will suffer the fallout from someday.

They are cheapening the munny units in order to give the appearance of rising asset (especially stock asset) units. Say it again… “they are cheapening the munny units in order to give the appearance of rising asset units.”

Hence, gold. The shiny rock, the bullion, the anchor to monetary sanity. In this surreal monetary realm, it is something real.

The goal of investing in or trading the gold mining sector is to capitalize on the desperate actions of monetary and fiscal policymakers vs. gold’s stability. Last week we covered a lot of details: Gold Stock Correction and Upcoming Opportunity. No need to repeat the details. People who know how to play this sector have been patiently managing the correction (whether that means selling into it, buying during it, being psychologically prepared for it, etc.) and planning for its end.

We keep a long list of quality miners, explorers, and royalty charts updated every week in NFTRH for this very outcome; an end to the correction and the next phase of gold’s bull market, which it is consolidating now, per this daily futures chart. If the negative RSI divergence does not resolve into a sharp drop soon it is going to then be big-time fuel for what could be a hysterical run-up to the 1940 target and possibly beyond.

Gold had become over-loved by financial refugees in March. They are now buying stocks again.* That is perfect because they should not be aboard the next phase. Their role will again be too knee-jerk and chase later on. Despite the consolidation since March, the daily chart (via TradingView) shows a completely intact situation at the up-trending 50-day average.

gold

Gold/SPX Ratio

I’ll leave you with one final chart. There has been a reason gold has underperformed the stock market since the terror of early spring. That reason is because cyclical asset markets are and have been on a massive sentiment relief rally and sentiment will do what it will do in the short-term. Just remember that simple fact when you see the inevitable rationale like this that certain interests will try to feed you: Here Come the Golden Ghost Stories.

Gold/SPX has done a great job of taking out the excess while remaining intact. 5-year chart…

gold spx ratio

The Not So Great Reset

Lunatics far and wide talk about something called “The Great Reset” but that too is tin foil, whether aspects of it are true or not. It does not help your market management to have that crap in your head. Instead, let’s boil down the picture to the gold sector and realize that as the terror-stricken sentiment of March and April is being reset, so to is the over-enthusiastic sentiment in the gold sector.

The next bull phase should be arriving before long.

* I have been selectively long the stock market since March as well, but very aware of the gathering risks, which I personally and the NFTRH service manage accordingly.

Check back to see my next post!

Best,
Gary Tanashian
nftrh.com

Subscribe to NFTRH Premium (monthly at USD $35.00 or a 14% discounted yearly at USD $365.00) for an in-depth weekly market reportinterim market updates and NFTRH+ chart and trade setup ideas, all archived/posted at the site and delivered to your inbox.

You can also keep up to date with plenty of actionable public content at NFTRH.com by using the email form on the right sidebar and get even more by joining our free eLetter. Or follow via Twitter @BiiwiiNFTRHStockTwits or RSS. Also, check out the quality market writers at nftrh.com.
This Unlikely Stock Is Hitting On All Cylinders

Daniel Cross - INO.com Contributor - Equities


It's no secret – it's a tough market out there. Oil prices are at record lows, the US dollar remains stubbornly strong, and now the Fed has all but admitted that the economy is weaker than expected and we might need to start preparing for negative rates.

In this kind of environment, smaller companies can often slip through the volatility. They can ride the waves of uncertainty and ignore macroeconomic hardships that plague their larger competitors making the smaller one an unlikely winner. If that stock is an industry which is trending higher, that's even better.

One stock in the communications sector is slipping through the noise and could be a huge opportunity for investors. The communications sector is widely viewed as an industry undergoing a rising tide, which as most investors know means it lifts all ships within that industry. Continue reading "This Unlikely Stock Is Hitting On All Cylinders"

USDJPY: "Diving" For Opportunity

By: Elliott Wave International

On a recent vacation to the Yucatan, my friend decided to get certified in scuba diving.

I, on the other hand, prefer breathing my air above water! But I did tag along with her to one of the classes, anyway. She learned how to handle and interpret all the various diver gauges: gas pressure, submersive pressure, depth, and on.

The one feature all those indicators had in common was a bold, red line to indicate the level the diver must obey to stay out of danger.

That's when it hit me: Scuba-diving is a lot like financial markets. Investors and traders jump in -- and use an array of safety gauges to keep them on the right side of price action.

Well, at least those investors and traders who use technical market indicators. For them, those bold, red lines indicating the point of danger -- those are equivalent to the most critical component of market analysis: protective stops. The second prices cross this line, it's time to "swim back up to the surface" and safely re-adjust your position.

For any investor/trader, then, the ultimate goal is to clearly identify these life-"lines" ahead of time, before jumping in. That, dear friends, is where our newest, FREE report "How to Set and Manage Stops With the Wave Principle" comes in.

Here is an excerpt: Continue reading "USDJPY: "Diving" For Opportunity"