Silver & Gold To Inform Dr. Copper

They call copper the metal with the Ph.D. in Economics. But these days Doctor Copper is little more than a quack in that regard, taking a cue from the metals whose interplay will be critical to deciding the coming macro for 2020 and the run-up to the next US election. Thus, they are the 3 Metallic Amigos, riding together but providing different signals at different times (this being nftrh.com, you will have to put up with the odd shtick from time to time).

Silver Gold Copper

As we have noted repeatedly, the Silver/Gold ratio takes it place alongside other indicators (like long-term Treasury yields, yield curve, TIPs ratios, inflation breakevens, etc.) of a would-be inflationary environment. When silver (more cyclical, commodity-like characteristics) rises vs. gold (more counter-cyclical, liquidity haven characteristics) it is a hint toward an inflationary macro.

A daily chart of silver/gold shows a constructive ratio at yesterday’s close and this morning in pre-market silver is +2.77% while gold is +.77%. The implication could well be an end to the current bull flag consolidation at the moving averages and the next upturn in silver/gold, the miners and possibly the inflation/reflation trades that tend to follow. Continue reading "Silver & Gold To Inform Dr. Copper"

Gold Update: $1616?

Last month, after gold had missed our primary target of $1577 and then started to collapse, I wondered if "A Bear Face Was Showing Up?". The price was still above the trendline support, although it dipped below $1500. I also spotted the potential reversal Head & Shoulders pattern, which was adding to the possible Bear Face.

Let's see below what you had been expecting from the market these days.

Gold

The most of your votes in the earlier ballot were for the "No" option, which means you didn't think that gold had topped already keeping bullish outlook, no matter what. The thing is that we don't know the right answer yet, as none of the triggers were pushed. To remind you, the Bearish confirmation is only below $1400, and the Bullish one is above $1557.

I want to share with you the anatomy of the failed Head & Shoulders pattern below to show what has gone wrong for educational purposes in the 4-hour chart below. Continue reading "Gold Update: $1616?"

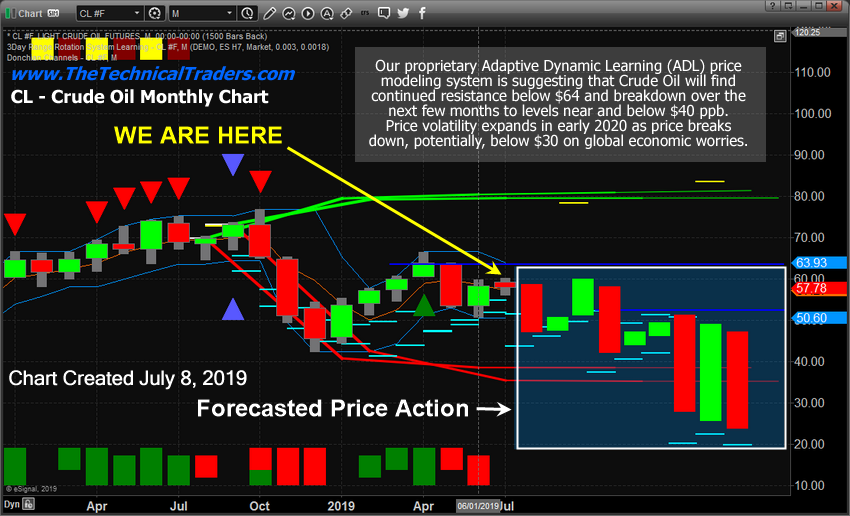
ADL Predicts Oil Prices Will Fall Below $40

There are times when our research team interprets our advanced predictive modeling systems so well that we call a move in the markets 3 to 10+ months in advance of the move actually happening. It has happened for our team of research so often lately that we are somewhat used to the accolades we receive from our followers and members. Our October 2018 Gold price predictions are still playing out accurately and continue to amaze people – even though we made these predictions over 12 months ago.

Today, we wanted to highlight our Adaptive Dynamic Learning (ADL) predictive modeling systems expectations for Crude Oil. The research post we made on July 10, 2019 (see below). At that time, we warned that crude oil was about to head much lower and that our ADL modeling system was suggesting that oil prices would rotate between $47 and $64 before breaking much lower in November 2019. Ultimately, oil prices will fall below $40 ppb following our timeline and could begin a broader downside move before the end of October 2019. Read our full prediction/research report from the link below.

Oil

SOURCE: July 10, 2019: PREDICTIVE MODELING SUGGEST OIL HEADED MUCH LOWER

We believe the support level near $50.50 will act as a temporary support level over the next 3 to 10+ days before a moderate price breakdown below this level begins. Our expectations for November 2019 are that oil prices may fall to levels below $45 ppb on a deeper downward price move, yet will recover to levels near $47 near December 2019/January 2020. Continue reading "ADL Predicts Oil Prices Will Fall Below $40"

Bitcoin Dropped To The Target

Many years ago, when I was fifteen, I was inspired to become a professional trader after I had read a magazine story about a so-called “whale, the large market player. He was moving the markets with large orders sent to his broker out of his luxury hotel room. Markets were panicking, and politicians were trying to soothe the public telling them “true” stories. But the truth is that the impulse of the price was generated first in the “whale’s” mind and then it reached the market through the skillful hands of his broker, no other reason, except his will. The concept behind his action is a real mystery, known solely by himself. He could use any kind of analysis to be successful. The remaining is just the “noise.”

We are not “whales,” and I am not fifteen anymore, but we can find market irregularities to turn it into a profit. Let politicians talk, media buzz and profit run.

The bitcoin structure has been developing prophetically accurate as per the plan, that I shared with you a month ago. The leading coin has dropped hard from what looked to be an unbreakable area at $10,000 to hit the most anticipated target of $7,800. The actual low was just a few dollars below it. Again, the majority of you have made the correct choice based on the chart structure I highlighted for you. Hopefully, our vision gets sharper over time.

This collapse extended the damage of the crypto to 43% from the top of $13,764 established in June. The media have naturally started the “noise,” but we were prepared for this move two months ago, and we are not going to buy their “truth” as they usually sell extremes of either doomsday or a tulip mania. None of this is going to happen soon. Some “whales” just pushed down the market reckoning old trading wisdom – “if they don’t buy then I sell.” That’s it. This is what I was telling you at the opening of this post. Continue reading "Bitcoin Dropped To The Target"

Silver/Gold Ratios Is A Guide As Inflation Signals Fade Again

The interplay between gold and silver is a critical component to understanding what is out ahead; to understanding whether long-term Treasury yields will rise and if they rise, whether it will be due to inflationary pressures. It is a critical component to understanding whether cyclical commodities and other aspects of a greater inflation/reflation trade will finally break existing downtrends. See…

The Continuum is Still in the Deflation Camp (9.24.19)

Pictures of a Reflationary Bounce-a-Thon (9.11.19)

The first and more recent post noted that the 30yr yield needs to climb above 2.2% to even think of hinting toward a temporary inflation trade. The chart from that post shows that while the Continuum is of a long, deflationary structure the periodic pings upward to the (monthly EMA 100) limiter often represent times of cyclical inflationary bursts. This morning the 30-year yield stands at 2.15%.

long-term treasury yields

As for the older post linked above, it was personally a little difficult not to buy in (other than for a couple of ‘bounce’ trades) to the prospect of the global inflation that Central Banks are trying to summon. But that post and others have routinely shown intact downtrends in the inflatables. So it was a case of ‘break the trends and we’ll talk inflation trade’. Here are the daily charts of the CRB index and a key headline commodity. Continue reading "Silver/Gold Ratios Is A Guide As Inflation Signals Fade Again"