My Big Trend Analysis For Silver Investors - Part 2

This, the second part of our Silver research article suggesting Silver may be forming a massive price base in preparation for an explosive upside move, will continue from Part I of this research series.

Our research team believes Silver is setting up in a price pattern that may already be “ripe” for an explosive upside move. Our researchers have poured over the data and believe the disparity between Gold and Silver is already at excessive levels.

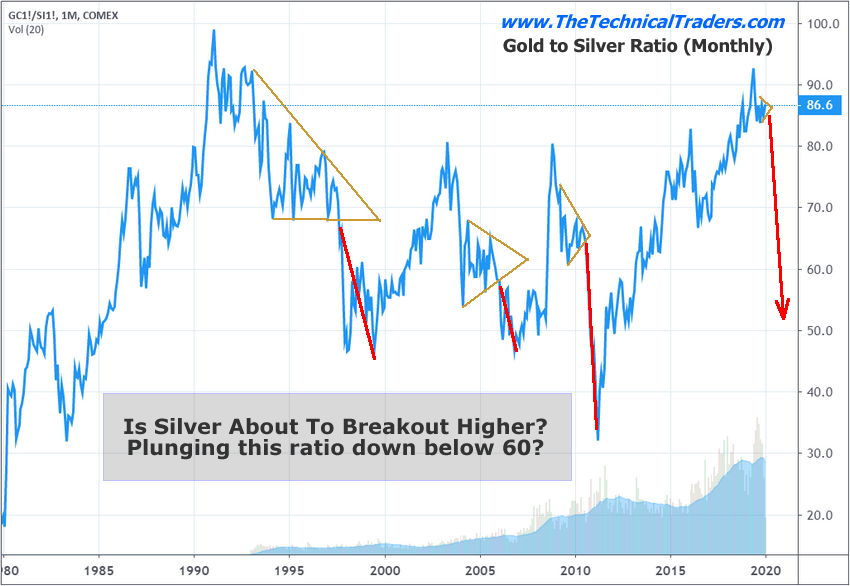
Historically, anytime the disparity between Gold prices and Silver prices (rationalized into comparative Gold price levels) breaches 30% to 60% and Gold begins an upside price advance, Silver typically begins to move higher with 4 to 8+ months. This setup pushes the Gold to Silver ratio back below 50 or 60 as Silver rallies substantially higher, and faster than the price of Gold.

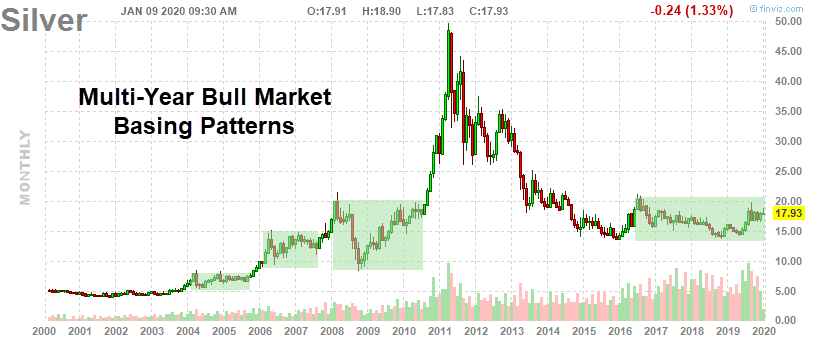
Comparatively, Silver continues to trade within a sideways price range after basing in early 2016. This price range has been fairly consistent between $14.50 and $21.0. With Gold recently starting to move higher because of the US/Iran military conflict, this raises an early warning flag for our research team because Silver has continued to trade below $18 – and well below recent highs near $20.

The price disparity between Gold and Silver is currently greater than 200% based on our proprietary modeling system. Remember, anytime this disparity level is greater than 30% to 60% and Gold breaks out in a rally, Silver will break to the upside within just a few months.

Silver Gold

The second stage rally in Silver, the real money-maker, will come when investors pile into Silver and Silver Miners as the breakout in Silver becomes explosive. The time to get into this trade is/was now or 4 months ago. Still, there is plenty of opportunity for skilled traders right now because the breakout move in Silver and Silver Miners has not really begun yet. Continue reading "My Big Trend Analysis For Silver Investors - Part 2"

My Big Trend Analysis For Silver Investors - Part 1

Everyone seems to be focused on Gold recently and seems to be ignoring the real upside potential in Silver. With all the global economic issues, military tensions, geopolitical issues, and other items continually pushed into the news cycles, it is easy to understand why traders and investors may be ignoring Silver.

Silver has really not started to move like the other precious metals. Gold is up over 45% since 2016. Palladium is up over 350% since 2016. Silver is up only 29% since 2016. The Gold to Silver ratio is currently at 86.7 – very near to the highest level on record going back over 25 years.

Silver

Historically, Silver rallies 6 to 12+ months after Gold begins a price rally. The big break in the Gold to Silver ratio comes at a time when Gold rallies by more than 30% to 60% faster than the price of Silver. In other words, when a major disparity sets up in the price of Gold compared to the price of Silver, then Silver explodes higher – which results in a drop in the Gold to Silver ratio. Continue reading "My Big Trend Analysis For Silver Investors - Part 1"

Pendulum Swing #9: Palladium Vs. Gasoline

2020 has kicked off, and it is time to see where the earlier Pendulum swing #8 has stopped to check if it worked properly. To remind you, we had pitted gasoline against natural gas and below are your bets for that experiment.

Gasoline

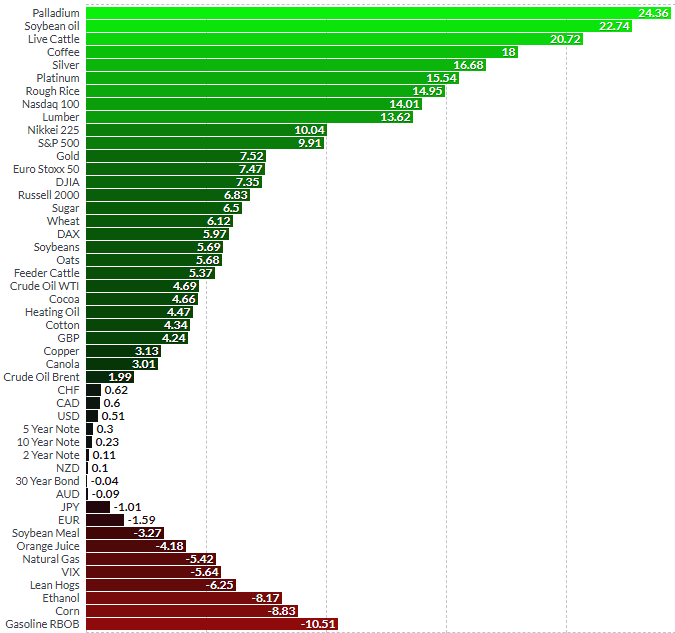
Bingo! The majority of you bet it right choosing Natural gas as a winner, and as you can see in the next chart that it has lost 5.42% as gasoline has dropped more than 10% to top the losers’ camp. I want to express my gratitude to those who chose the experiment success option for your trust! So, after the earlier failure in the first half of 2019 (7th swing), the Pendulum experiment is back on a winning track! We got only 2 failures out of 8 experiments now. Let’s push it again and see what happens.

Half Year Futures Performance (Second Half Of 2019)

Gasoline
Chart courtesy of finviz.com

The regular champion and the buzz maker palladium has topped the chart again for the past half of the year as it scored the most with more than 24% gain. On the other side of the scorecard, there is the former champion gasoline, which failed to perform in the earlier contest. Continue reading "Pendulum Swing #9: Palladium Vs. Gasoline"

A Market Festivus

They say that Festivus is the “anti-Christmas”, but in this case we are going to call it the anti-Christmas Eve as the markets close out 2018’s Christmas Eve massacre.

“Many Christmases ago I went to buy a doll for my son. I reached for the last one they had, but so did another man. As I rained blows upon him I realized there had to be another way!”

This year markets are going another way.

Market festivus

We have been managing a potential Christmas Eve close-out sale in the stock market since SPX hopped the Bull Turnstile, negating topping potential and confirming bullish ascending triangles (not shown below as they appeared on daily charts) and its own major trends by breaking upward. Here is the most recent chart (from NFTRH 582) used to illustrate the situation.

Please consider this weekly chart for reference only. We had a lot of words in #582 about what I think is in play, but ultimately this public post is simply illustrating what is currently in play. And that is an upside extension (with associated sentiment readings to be updated this weekend in NFTRH 583) that would be roughly equal and opposite to the 2018 downside blow off (note: though the chart allows for higher levels, SPX has already qualified for a price and sentiment close-out, in the general spirit of the season). The blue box is the same height as the yellow shaded area. It’s more art than TA, but there you have it… some frame of reference. Continue reading "A Market Festivus"

Gold & Silver: Santa Claus Rally Postponed

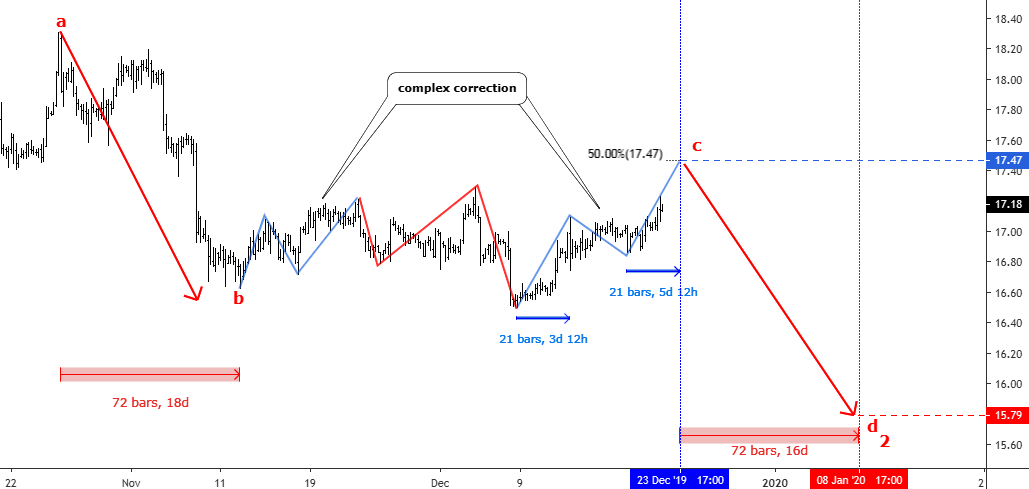
Both metals missed the time targets, which were set on the 13th of December for gold and on the 20th of December for silver in the previous post as I was expecting the Last Drop Ahead Of Santa Claus Rally.

I updated the charts below and went deep into the anatomy of the current consolidation in the "bc” segment to show you in detail what holds the price for so long delaying the last drop. For that reason, I switched to a lower time frame of 4-hour.

Let me start with the silver chart as it has a less complicated structure than gold, and I will use it as a navigator.

Chart 1. Silver 4-hour

Silver
Chart courtesy of tradingview.com

Corrective structures are tricky as I always repeat it as a mantra, but it really has such a nature as it reflects the uncertainty in the market mixed with attempts of different market forces to break out of the current status quo. This creates sharp zigzags and false breakouts as we see it on the silver chart above. Continue reading "Gold & Silver: Santa Claus Rally Postponed"