Is Gold Poised To Move Higher?

Polls show that you were optimistic about the probability of another rally for top metals. Both of them go well with the maps that I shared earlier this month. Let's see, in the updated charts below if they are going to justify your bold expectations.

Gold is the first as it has a stronger position now.

Gold
Chart courtesy of tradingview.com

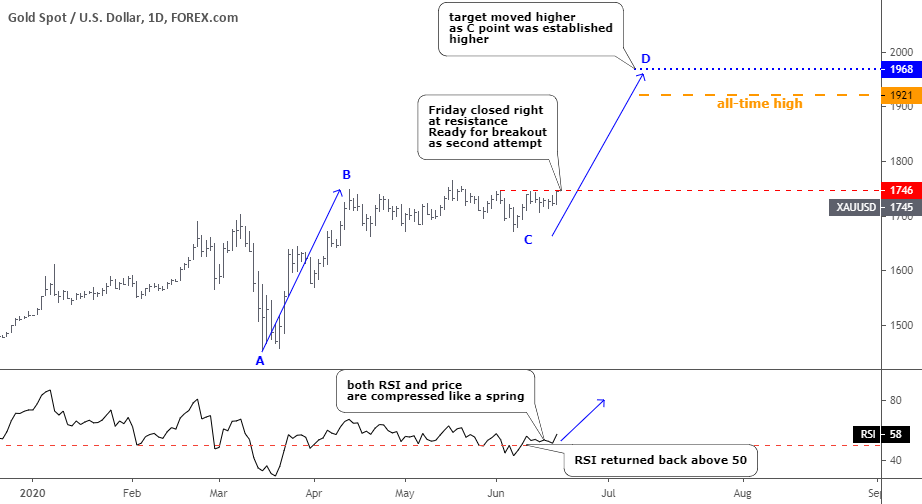
The top metal completed the sideways consolidation that I showed you two weeks ago. It didn't touch the 38.2% Fibonacci retracement level at $1636 as it stopped at $1671, which is even higher than the first leg of this corrective structure, which was established at $1661. It is an entirely natural outcome as the last leg down started at $1766, also higher than the top of the first leg did at $1748. The second leg down was longer ($95) than the first leg ($87). Continue reading "Is Gold Poised To Move Higher?"

Gold Falls As Silver Misses Target

Both top metals couldn’t sustain the growth, although silver was more convincing than gold this time again.

Let’s start with the updated gold chart below.

gold
Chart courtesy of tradingview.com

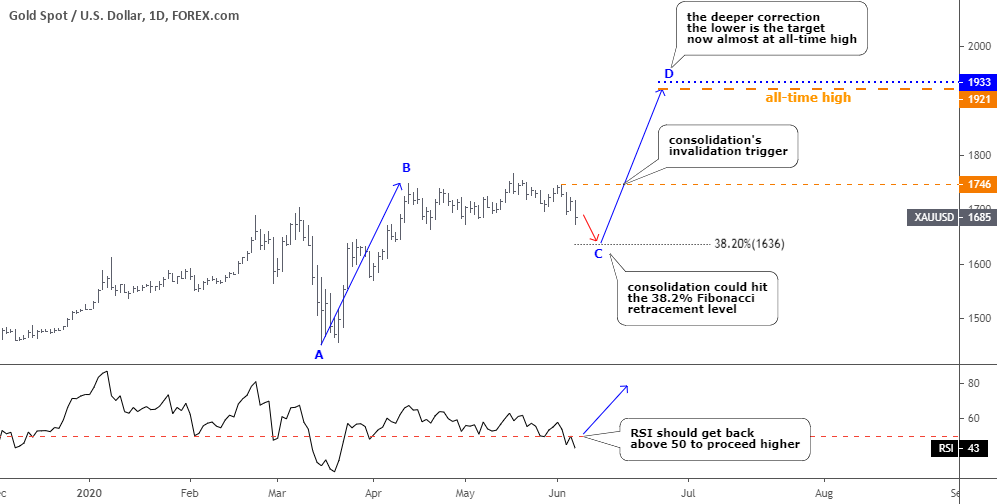
Gold is still consolidating as it couldn’t overcome not only the nearest peak of $1766 but it also failed right at the top of the AB segment of $1748. The RSI dipped into the bearish zone below the crucial 50 level. So, it’s the right time to put our classic instrument called Fibonacci retracement level as gold watches ground while both feet are in the air. The first important 38.2% Fibonacci retracement level could offer support at $1636. Continue reading "Gold Falls As Silver Misses Target"

Silver/Gold Ratio Hits Target

The NFTRH plan is and has been that the gold mining sector, due to the fundamentals implied by the handy graphic below, could eventually lead a world full of inflatables higher. The miners, leveraging gold’s outperformance to most everything else during liquidity crises and even deflation, move first and draw in the inflationist bugs later. If the macro goes inflationary the miners will likely continue to perform well (ref. the 2003-2008 period) but would no longer be the go-to sector.

Then the play theoretically spreads far afield into commodities, global stocks (e.g. EM, Asia, etc.) and US markets/sectors that tend to benefit from the rising long-term yields (e.g. banks, materials, etc.) resulting from inflationary macro signaling. These would be aspects of a sustainable inflation/reflation trade IF the signals are in order. So let’s take a look at some of them.

The Silver/Gold Ratio (SGR), a reflationary risk ‘on’ indicator has hit our upside target, which we have tracked in NFTRH updates over the last few weeks using the yellow box highlighting an area near the down-trending 200-day moving average that would at least temporarily halt the party. The SGR is pausing and pulling back a bit here. All normal so far. Continue reading "Silver/Gold Ratio Hits Target"

Are Palladium, Gold And Silver Set To Takeoff?

In this post, I'll go over the charts for palladium, gold and silver, but first I would like to start with palladium futures as it has the most potential gain to reach this round. At the start of May, I shared with you the map with equal opportunities for this champion metal to either break up or down. Here is how you saw the future for palladium in the graph below.

Palladium Poll

The majority chose the “break down” option, although with a minor advantage, but this bet played out as the metal’s price dipped one more time in the third leg down of a large correction. You were right again!

Now, let’s get down to the hot opportunity that I spotted for you on the palladium futures daily chart as it’s worth watching on the Gold & Silver Primetime.

Palladium Gold Silver
Chart courtesy of tradingview.com

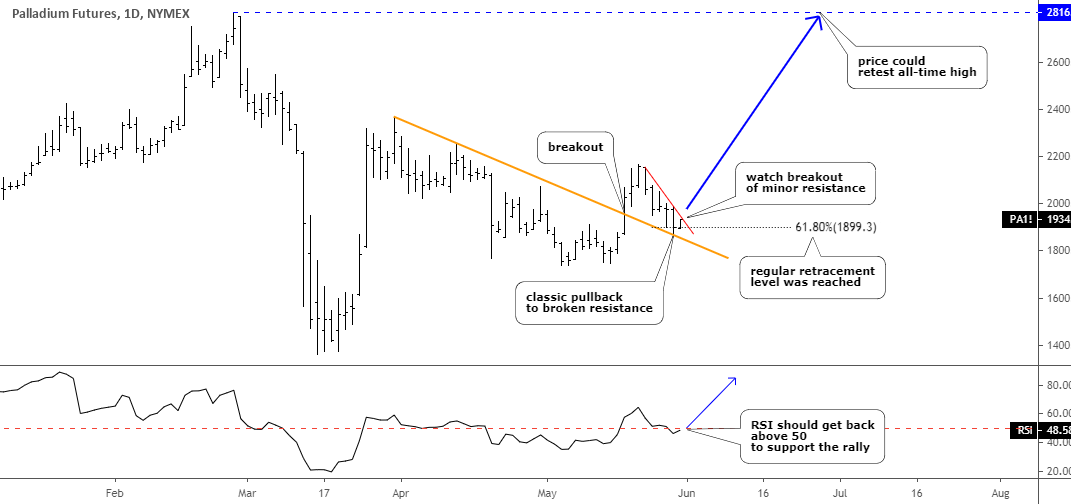
The chart structure of palladium futures on the daily time frame could indeed be posted in the trading textbook as it is neat and smooth. I put detailed explanations here and on the chart as this metal gives such an excellent opportunity for education. Continue reading "Are Palladium, Gold And Silver Set To Takeoff?"

Is A Blow-Off Top Setting Up

Our research team has become increasingly concerned that the US Fed support for the markets has pushed price levels well above true valuation levels and that a risk of a downside price move is still rather high. Recently, we published a research article highlighting our Adaptive Dynamic Learning (ADL) predictive modeling system results showing the US stock market was 12% to 15% overvalued based on our ADL results. Today, Tuesday, May 26, the markets opened much higher, which extends that true valuation gap.

We understand that everyone expects the markets to go back to where they were before the COVID-19 virus event happened – and that is likely going to happen over time. Our research team believes the disruption of the global economy over the past 70+ days will result in a very difficult Q2: 2020 and some very big downside numbers. Globally, we believe the disruption to the consumer and services sector has been strong enough to really disrupt forward expectations and earnings capabilities. We’ve been warning our friends and followers to be very cautious of this upside price trend as the Fed is driving prices higher while the foundations of the global economy (consumers, services, goods, and retail) continue to crumble away.

Our biggest concern is a sharp downside rotation related to overvalued markets and sudden news or a new economic event that disrupts forward expectations. Q2 data will likely be a big concern for many, yet we believe something else could act as a catalyst for a reversion event. Possibly global political news? Possibly some type of extended collateral damage related to the global economy? Possibly something related to earnings expectations going forward through the rest of 2020 and beyond? We believe Continue reading "Is A Blow-Off Top Setting Up"