U.S. Stock Market Rolls Lower

Stock market price action is usually conducted in a series of up and down price phases – or waves/cycles. Typically, price will move higher or lower in phases- attempting to trend upward or downward over time. This type of price action is normal. Extended upward trends with very little downward price retracements happen sometimes – but not often. They usually happen in “excess phase” rallies or after some type of news event changes expectations for a symbol/sector.

Putting Concerns Into Perspective – Still Bullish

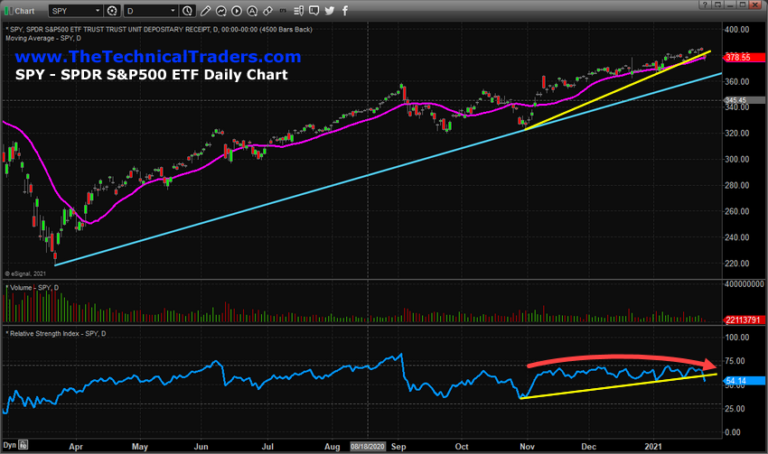
Since early November 2020, the US stock market has continued to rally in a mode that is similar to an excess phase rally – showing very little signs of moderate price rotation. While price volatility has continued to stay higher than normal, you can see from the SPY Daily chart below that it has rallied from $324.40 to $385.95 (over 18%) in just under 90 days. At some point in the future, a moderate price rotation/retracement will happen that may be in excess of 6% to 11% – as has happened in the past.
Stock Market

The purpose of this research post is to alert readers that the markets appear to have started a period of downside price rotation – which is normal. This SPY Daily chart, above, highlights the upward support channel originating from the March 21, 2020, COVID-19 lows (CYAN line) and also the upward support channel originating from the early November 2020 lows (YELLOW line). Continue reading "U.S. Stock Market Rolls Lower"

S&P 500, Dollar Index, Gold, And Silver Updates

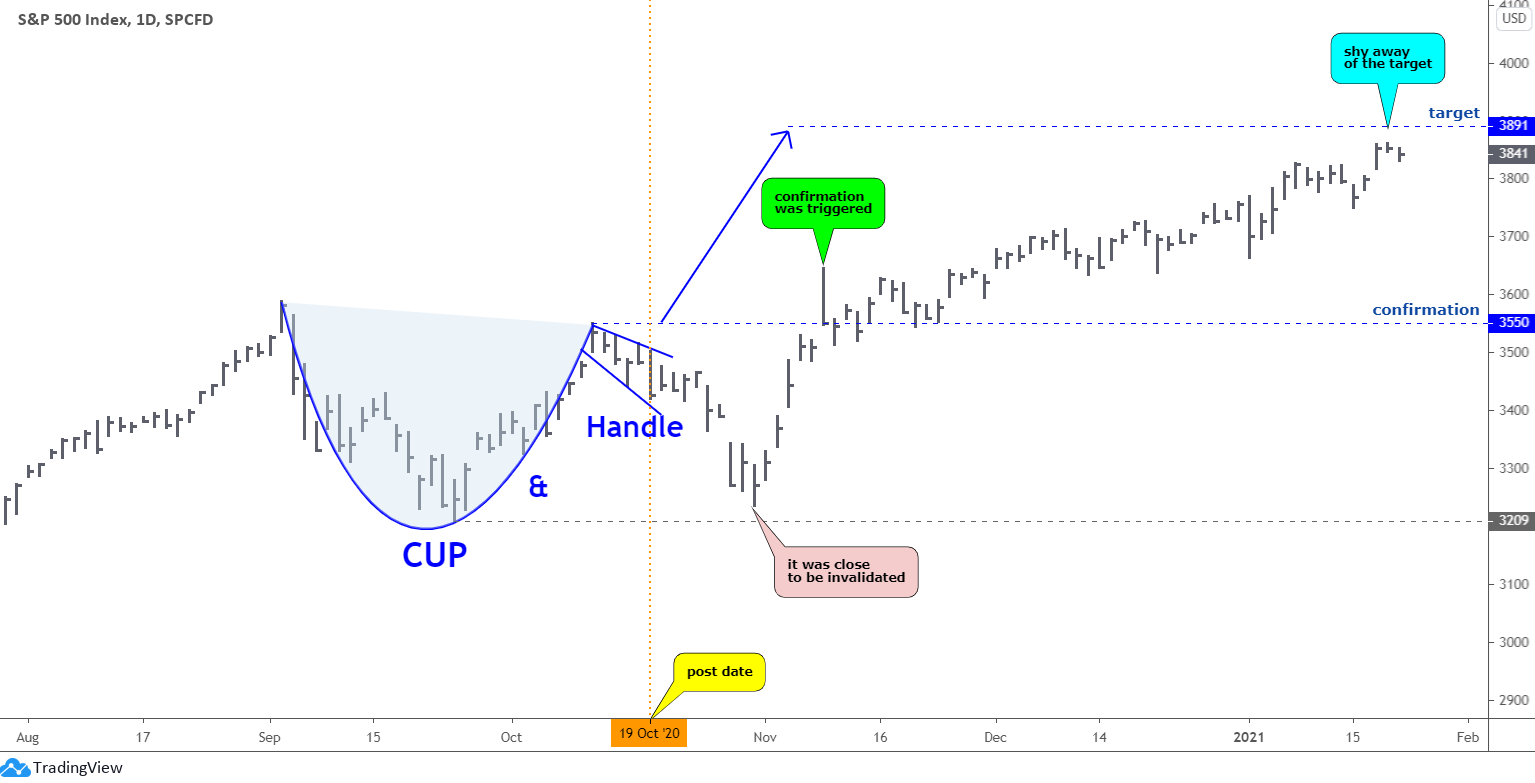
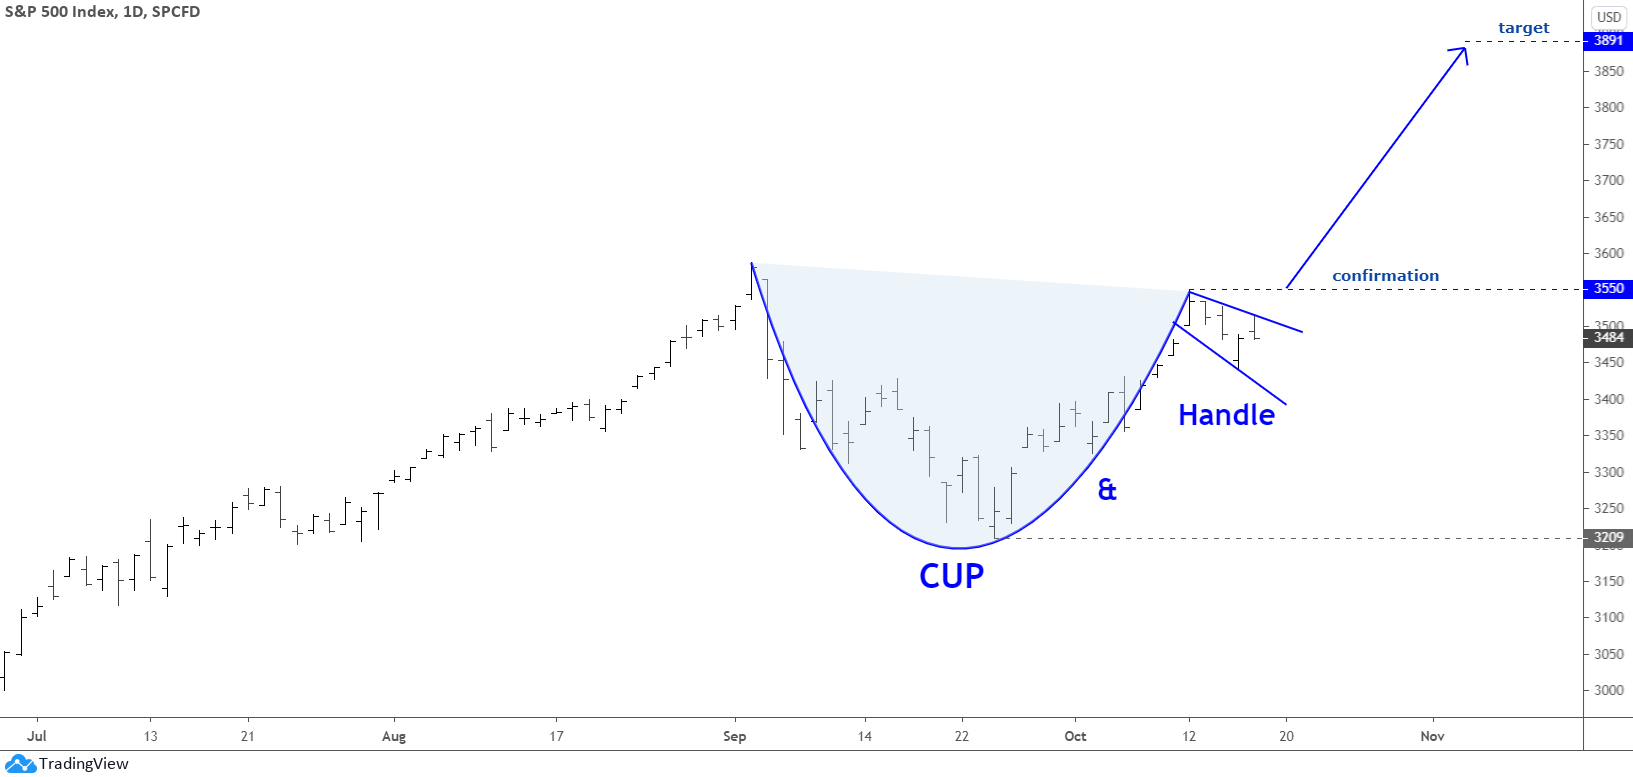
Before I start this update about the dollar, gold and silver, I would like to show you how accurate your prediction was for the S&P 500 back in October of 2020! At the time, I demonstrated to you the well-known Cup & Handle pattern in the making. That model was promising as the target was set at an ambitious $3891 level. Let us see it again below to refresh the memory.

S&P 500, Dollar Index, Gold, And Silver Updates

When I asked your opinion, whether this pattern is valid and will play out, most of you replied positively and supported my target. Let us see in the updated chart below how it played out.

S&P 500, Dollar Index, Gold, And Silver Updates

Your "crystal ball" worked perfectly as the new record maximum established last Thursday at $3860 had been just $31 below the target. The price action was not straight to the target as after the post, the price dropped quite deep, and the whole model was close to invalidation. Luckily, the further reversal built the "no look back" upside move. Continue reading "S&P 500, Dollar Index, Gold, And Silver Updates"

Gold & Silver: The Dollar Still Looks North

The bouncing U.S. dollar index (DXY) makes the game these days for the top metals, so I added its chart below to show you the possible path of the next move.

U.S. Dollar Chart

Most of you agreed with the map that I showed you a month ago. It indicated more downside for the DXY. On the 6th of January, the dollar established a new valley at 89.21, proving we were right. The price followed the red zigzag down and even the turning point set around 89.5. Continue reading "Gold & Silver: The Dollar Still Looks North"

Custom Valuations Index Suggests Precious Metals Will Decline

My team prepares Custom Valuations Index charts to understand how capital is being deployed in the global markets alongside US Dollar and Treasury Yields. The purpose of the Custom Index charts in this article is to provide better insight into and understanding of underlying capital movements in various market conditions. Recently, we discovered the Custom Index chart shares a keen alignment with Gold (and likely the general precious metals sector). Let’s explore our recent analysis to help readers understand what to expect next in precious metals.

Weekly Custom Valuations Index Chart

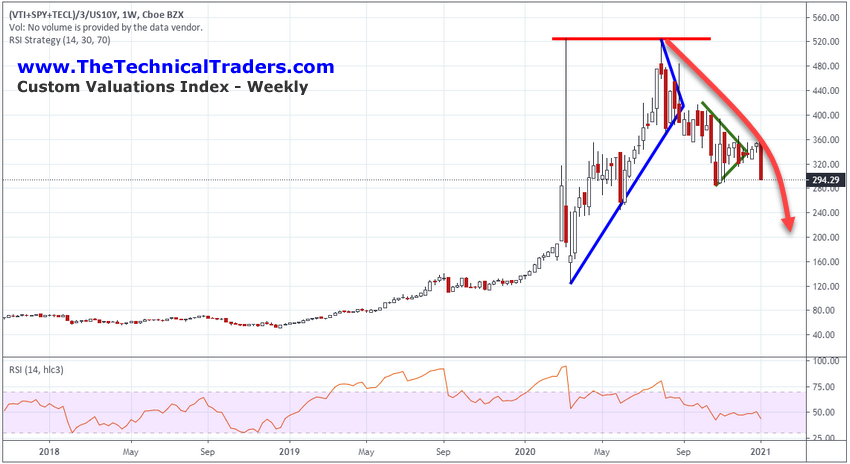
The first thing that caught my attention was the very clear decline in the weekly Custom Valuations Index recently, as can be seen in the chart below. The second peak on the Custom Valuations Index chart occurred on the week of August 3, 2020. Gold also peaked at this very same time. This alignment started an exploratory analysis of the Custom Valuations Index and the potential alignment with the precious metals sector.

Custom Valuations Index

The peak in the Custom Valuations Index on March 20, 2020 (near the height of the COVID-19 market collapse) presented a very clear upside target which was confirmed with a second peak level in August 2020. The fact that the Custom Valuations Index reached that peak level again and that peak level also aligned with the peak price in Gold may just be a coincidence. As we continue to explore this unique alignment, we’ll explore more unique characteristics to see if there is a link that is more than mere chance. Continue reading "Custom Valuations Index Suggests Precious Metals Will Decline"

Yield Curve Relentlessly Steepens

Another week, another yield curve steepener and continuation of the trend that began in August 2019.

yield curveyield curve

Flipping to the bigger picture I added in SPX, Gold, and the CRB commodity index for reference. With the levels of MMT TMM (total market manipulation) injected in the markets since Ben Bernanke cooked up the diabolical macro manipulation known as Operation Twist, I can’t pretend to quant the past to the present… Continue reading "Yield Curve Relentlessly Steepens"