Bitcoin Update: Reversal Or "Dead Cat Bounce"?

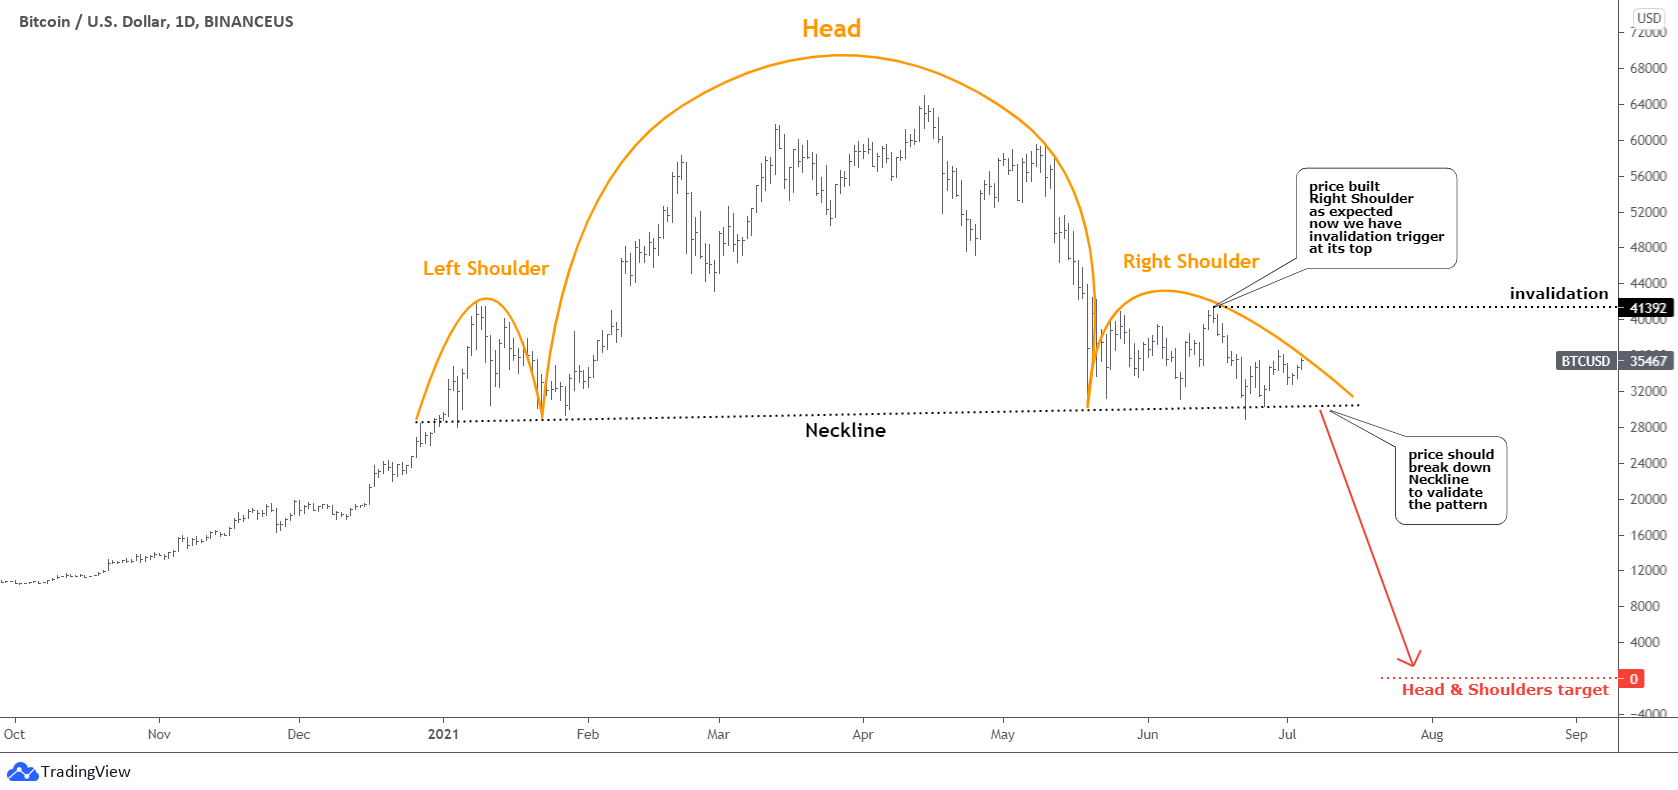
Bitcoin was in the “To Be Or Not To Be” situation last month as the giant Head & Shoulders pattern emerged to target the utter annihilation of Bitcoin.

This strong support that most of you have shown in the last poll for the main coin kept it from the collapse into the abyss. Let me show you on the chart below what has happened with the terrifying pattern since then.

Bitcoin Head And Shoulders Chart

The model looked just perfect as the price reached the final trigger of the Neckline after building the anticipated Right Shoulder to accumulate enough power for the breakdown. However, the first attempt in late June has failed. The next attempt at the end of July was not as powerful as the angle of attack was not sharp enough, and momentum quickly evaporated after a false breakdown. Continue reading "Bitcoin Update: Reversal Or "Dead Cat Bounce"?"

HUI Technical Status And Gold Stock Fundamentals

A review of the situation in gold stocks. It is, in essence, a year ago that Warren Buffett ill-timed his entry into the gold stock sector, unwittingly calling a top to the post-crash rally and signaling the start of the 2020 inflation trades, which did not include gold stocks (for logical reasons, as belabored in NFTRH and at NFTRH.com over the years). Increasing the view that ole’ Warren was playing contrary indicator last summer were the usual gold perma-bull suspects coming out immediately after with bullhorns a blaring as we noted in real-time on August 17, 2020: Buffett Buys a Gold Stock!

In the scope of the entire correction, as the bids rotated out of the precious metals and to a lesser degree growth/tech stocks into value stocks and cyclicals (including commodities) the inflation-instigated reflation trades hit stride, and gold stocks were sent on a long decline. Again, if you tune out the perma-touts and think rationally, the miners were only doing what they should do (see below).

There were two false breakdowns, the second of which sparked a strong rally. We also caught Mr. Buffett for a contrary signal to that rally on February 17, 2021: Buffett Pukes a Gold Stock!

The rally terminated at a key resistance level (as plotted well ahead of time as a caution zone in NFTRH) and here we are with HUI below its down-turning SMA 50 and SMA 200 (which needed to hold as support in order to maintain a constructive view), back in the downtrend channel (actually the Handle to a still bullish big picture, which is beyond the scope of this post) and the near-term bounce that I had been expecting has finally arrived after the rude interruption of an unexpected lower low.

That low came off of positive RSI and MACD divergences and here we are, on the bounce with the channel’s upper line, the down-sloping moving averages, and a clear lateral resistance area all taunting… “‘C’mon Huey, we dare you!” Continue reading "HUI Technical Status And Gold Stock Fundamentals"

Palladium Futures To $4,628?

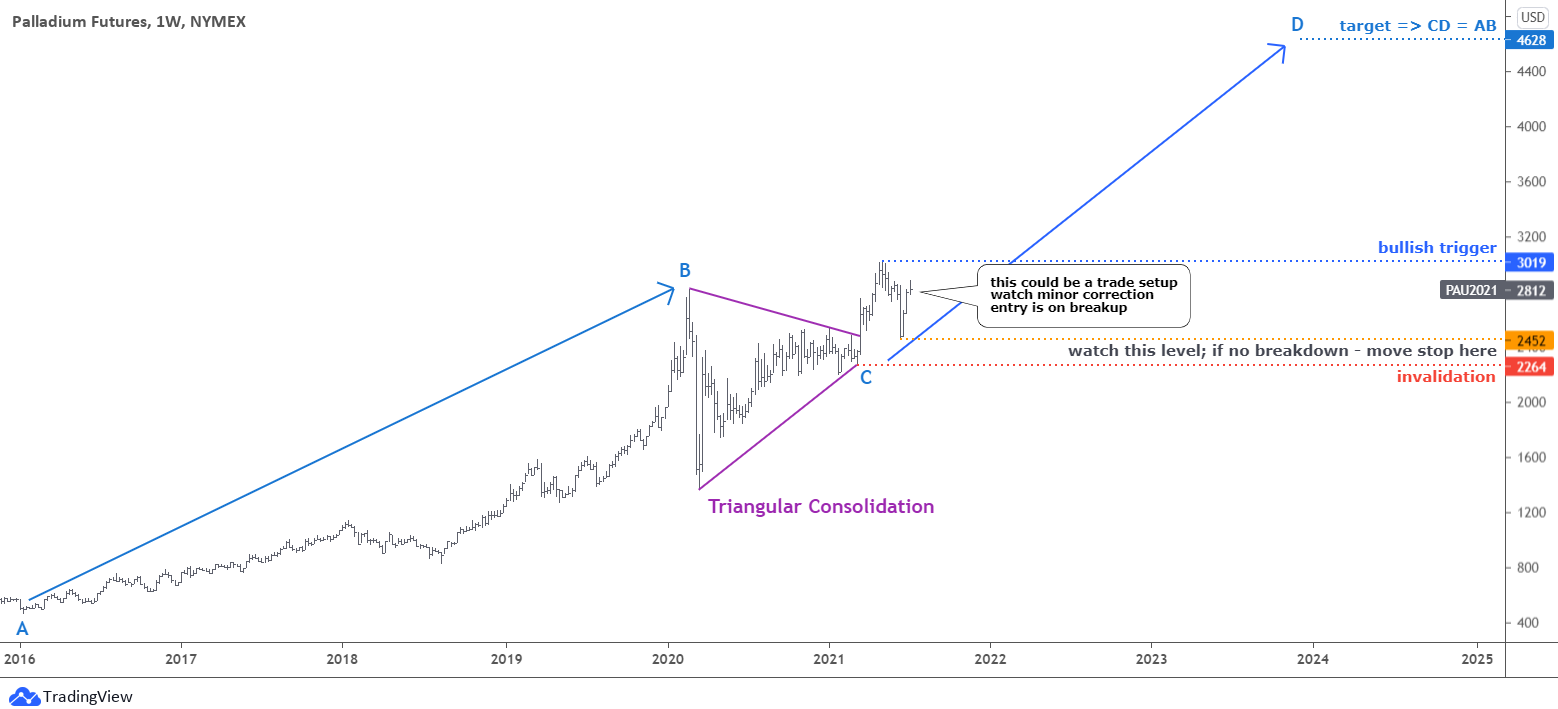
Last summer I spotted a hot trading opportunity for you with 45% potential gain as Palladium futures were set to retest the all-time high. The progress was not as nimble as I thought; however, the target was reached this April as the price even overlapped it. Most of you supported that option, and I hope you enjoyed that gain.

Weekly palladium Chart

It looks like this champion metal offers another stunning opportunity for traders.

The crawling move to the upside since 2016 with a rocket style ending in 2019-2020 was marked as AB part. Continue reading "Palladium Futures To $4,628?"

Bitcoin, Ethereum, And Ripple Update

Bitcoin invalidated the short-term pattern posted last month as it pulled both sides’ triggers and then returned to the current equilibrium. The other large-scale pattern is good to go.

Bitcoin, Ethereum, And Ripple Update - Bitcoin Daily Chart

I assumed that the right shoulder has been in progress with a possible spike to the upside. The price accurately followed that forecast as the price even surpassed the previous top to mirror the extreme in the left shoulder. Both shoulders peaked almost in the same area as the entire pattern aligns horizontally. Continue reading "Bitcoin, Ethereum, And Ripple Update"

Gold & Silver: Fed Boosted The Dollar

Last Thursday, the dollar rallied, reaching a two-month high versus major currencies, a day after U.S. Federal Reserve shocked markets by projecting a hike in interest rates and an earlier end to emergency bond-buying.

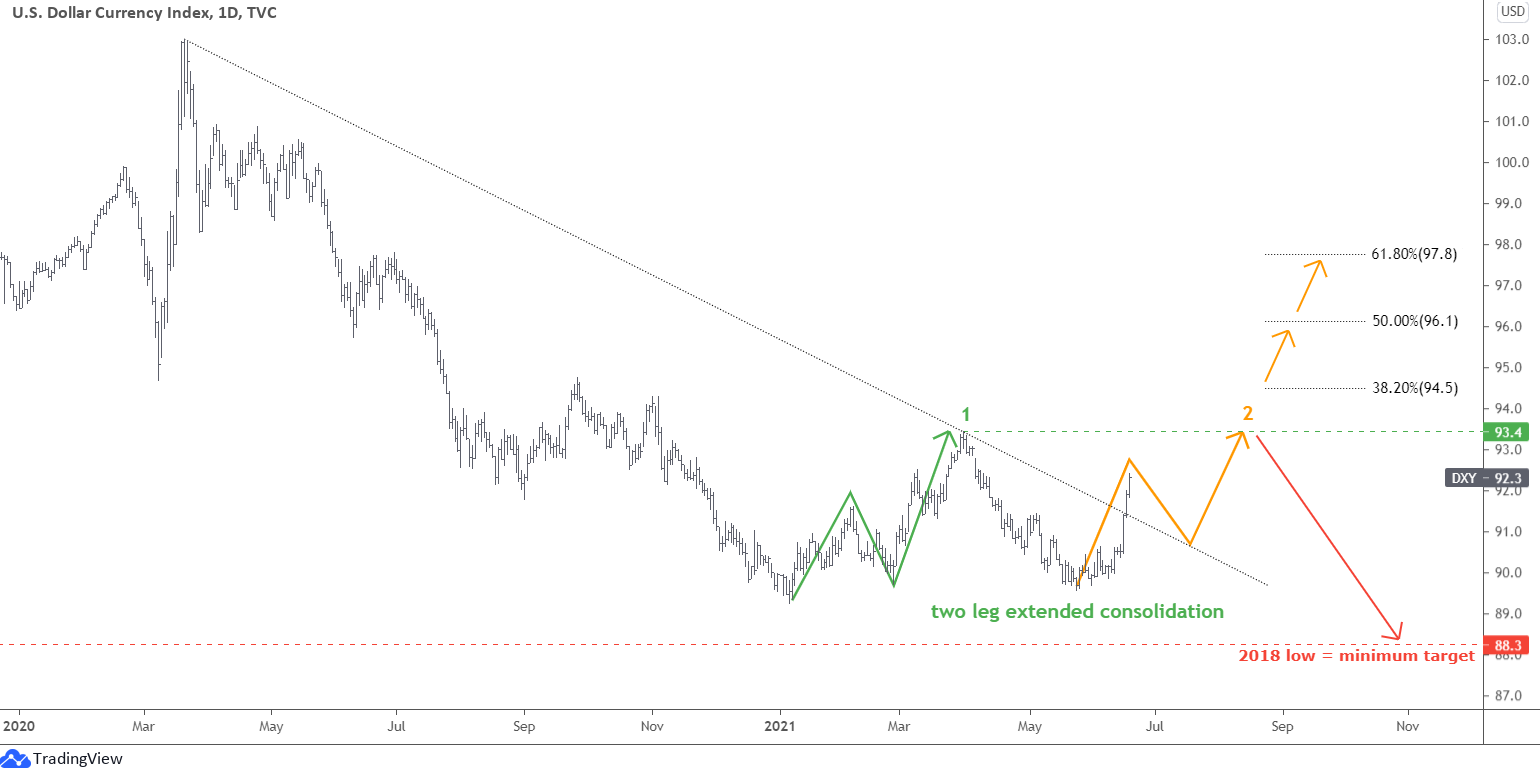
Daily US Dollar Chart

The price broke above the black dotted trendline resistance, which does not look like a minor correction. Instead, I think this is an extension of a large retracement of the entire move down that started in March of 2020.

The market could build the second leg of this large consolidation marked with an orange color. I highlighted the last leg with a green zigzag to the upside. The current leg up could repeat the same two-movement structure, so I built the orange zigzag. The first move within a second leg up could be over. I expect the upcoming pullback to retest the broken trendline resistance. After that, the retracement could resume and hit the top of the first leg at 93.4. Continue reading "Gold & Silver: Fed Boosted The Dollar"