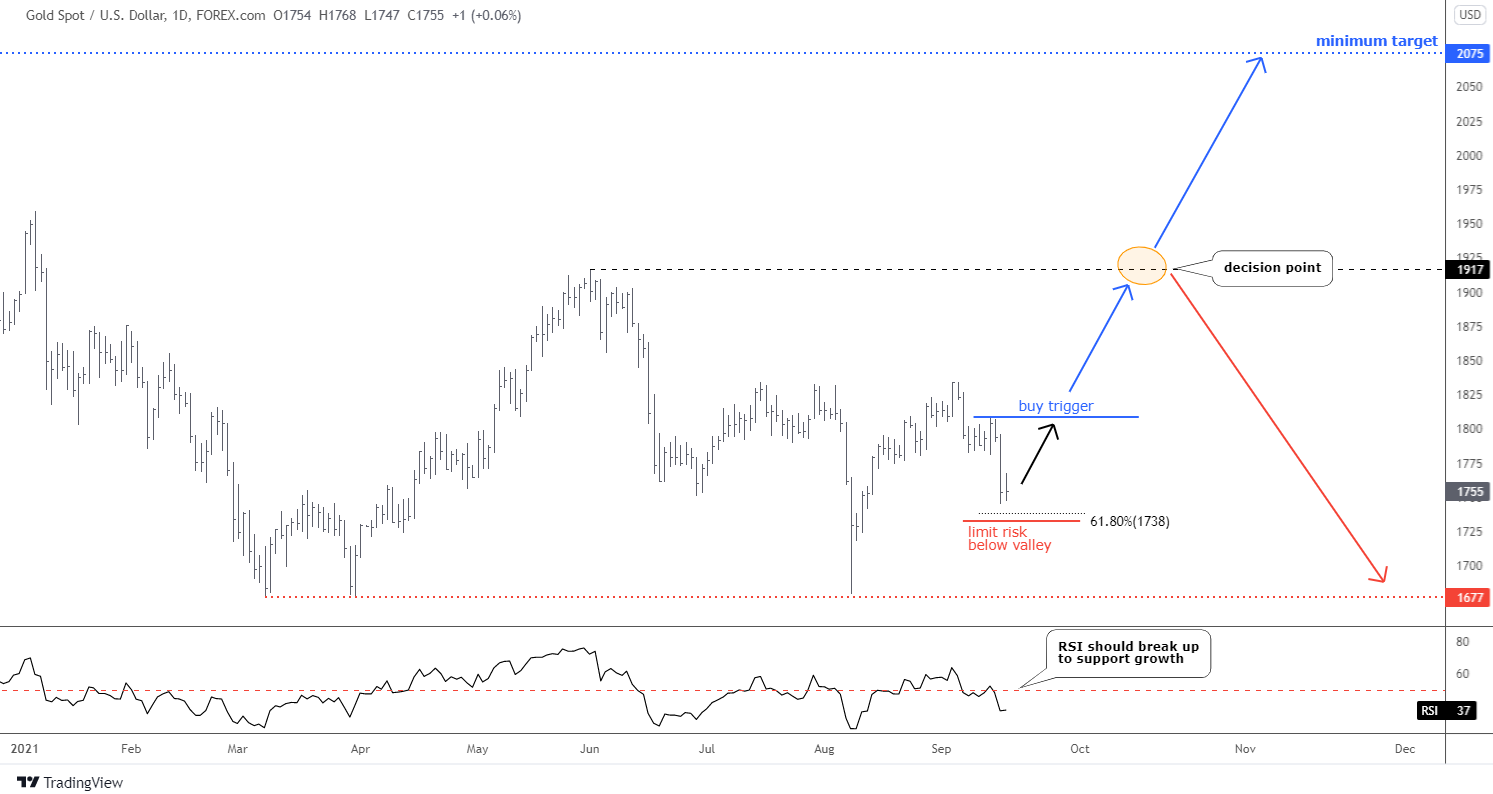
Gold follows the map posted in an earlier update.
Gold dropped within two visible legs close to the area of 61.8% Fibonacci retracement level located at $1,738. The second leg down has overshot the size of the first leg reaching almost 1.272 of its distance. The RSI has shown two legs down either. Initially, the 50 level in the indicator’s sub-chart acted as a support, and then it turned resistance for the joint between two legs. Continue reading "Gold Builds Buy Setup, Is Bitcoin Next?"


