Please enjoy this updated version of weekly commentary from the Reitmeister Total Return newsletter. Steve Reitmeister is the CEO of StockNews.com and Editor of the Reitmeister Total Return.Click Here to learn more about Reitmeister Total Return
It’s been a couple weeks since my last commentary thanks to a much enjoyed vacation. Gladly most of that time stocks were in the plus column as the market rightfully bounced from recent weakness.
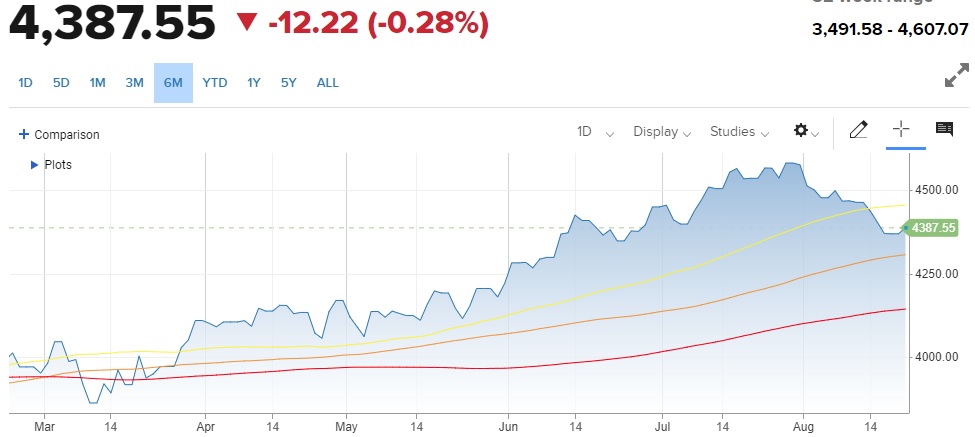
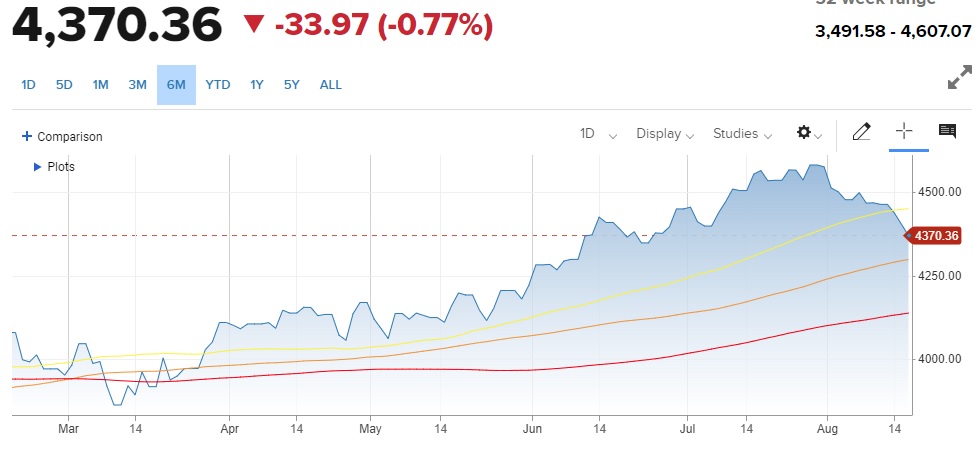
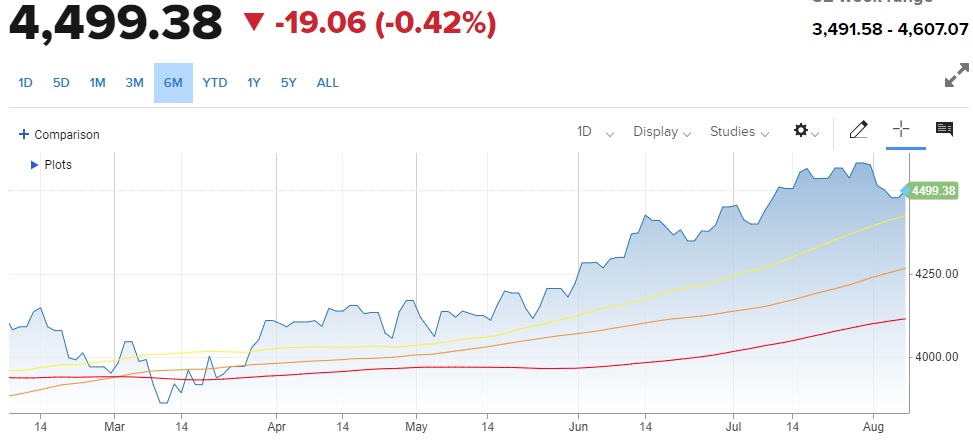
This fits in with my theory that we will be playing around in a trading range for a while. 4,600 for the S&P 500 (SPY) being the top end of the range and 100 day moving average (currently at 4,337) framing the bottom.
How long will we be in the range?
And what will be the catalyst to finally break out of the range?
And what are the best trades for this market environment?
Those key questions and more will be explored in this week’s Reitmeister Total Return commentary.
Market Commentary
As expected, the early August downturn was nothing more than a healthy round of profit taking after the tremendous bull run that started in March. Thus, after seeing a fairly customary 5% pullback investors were ready to hit the buy button again pushing stocks the S&P 500 higher.
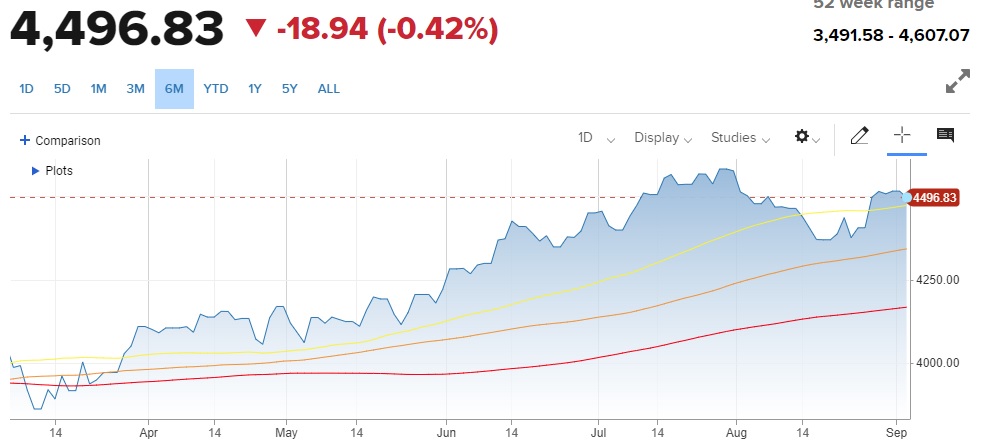
Moving Averages: 50 Day (yellow), 100 Day (orange), 200 Day (red)
The recent bounce is nice…but are investors truly ready to break out of the range and make news highs above 4,600?
I believe the answer lies in a review of the recent slate of economic events. This should tell us if we have the proper catalysts in place to race to new heights:
8/25 Jay Powell @ Jackson Hole: Remember that last time in 2022 Powell scared the pants off investors with his hawkish rhetoric. The key line being to expect economic pain (recession and job loss) before their war on inflation was over. This led to stocks going on a severe two month sell off to bear market lows in October 2022.
This time around Powell gave the usual sound bites. Inflation is too high…more work to do…may need to raise rates.
At first, investors were still in correction mode and hung on the words about “may need to raise rates”. This initially put some red arrows on the board. But as the day progressed investors realized that it was truly no different than any speech given by the Fed in the last several months. From there stocks leapt higher and have not looked back.
9/1 Government Employment Situation: Pretty much right on the money at 187K jobs added. The big surprise was how the unemployment rate unexpectedly jumped from 3.5% to 3.8% as the participation rate also went up. The best part of the report was that wage inflation continues to moderate with a lower than expected +0.2% month over month increase (that is only about 2.4% annualized…not far off the Fed’s target).
This all fits in with the narrative that the Fed is making serious headway with inflation and that more rate hikes are likely not needed. The bigger question is when rates can start to head lower. They say that is a 2024 issue…perhaps true. But it is still possible to start in late 2023. Either way it was welcome news to stocks that rallied hard on this news to end a strong week of price action.
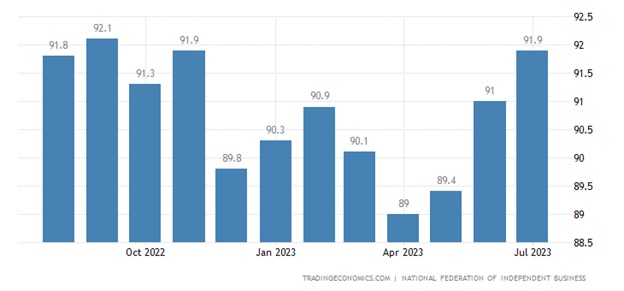
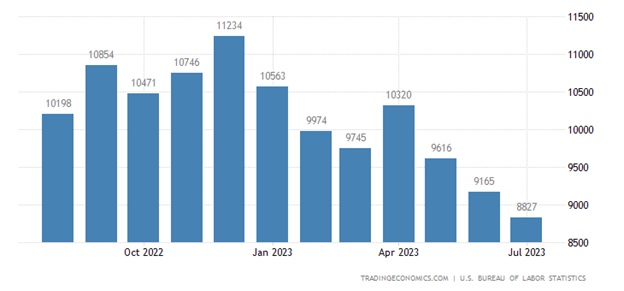
Note that back on 8/29 the JOLTs report gave clues that the jobs market is softening with fewer and fewer job openings (see chart below). This trend also speaks to the likelihood of moderating wage growth which is one of the stickier parts of the inflation picture.
9/1 ISM Manufacturing: This has been the weakest part of the economic picture with 9 straight readings under 50. Make that 10 months now with the 47.6 reading. Gladly that is the 2nd straight month of improvement. Note the PMI version of this monthly report was even more optimistic.
And now a glimpse of the key reports that lie ahead:
9/6 ISM Services: This is the larger, and healthier part of the economy where we got a 52.7 reading last month. Right now expectations call for a fairly similar reading of 52.4. Yet I suspect the strength of the most recent Retail Sales report may say there is some upside to that number.
9/13 Consumer Price Index (CPI): Investors like to focus on this inflation report even though the Fed has consistently said they find the Core PCE reading to be the much more reliable inflation indicator. Regardless, this has been trending nicely lower and mostly coming in under expectations for the past several months.
Too much focus is given to the year over the year # which has a lot to do with inflation many months ago. That is why experts like to drill down to the month over month readings which gives a sense of the current pace of things. That is expected to modulate to +0.2% which again is getting much closer to the Fed’s 2% annualized target. And will have folks readjusting odds for what happens on the next item…
9/20 Fed Rate Announcement: Right now it’s a forgone conclusion the Fed will stay put on rates at this meeting. What is not as certain is whether they have one more rate hike up their sleeves…and when they finally start lowering rates as the longer they leave these restrictive policies in place…the more they risk a recession forming.
Right now the CME calculates 40% odds of 1 more hike by the end of the year (either at November or December meeting). Honestly, with the facts in hand, I don’t see that happening. The nails are already in the inflation coffin. Just better to apply some patience to see it through as Fed policy typically has 6+ months of lagged effects.
Expectations & Trading Plan
We are in a young bull market…but still not out 100% out of the woods. Meaning the Fed has a history of going too far with their policies thereby creating a recession.
I sense this group is wiser than some of their predecessors and will manage the soft landing from which they can lower rates…which will be an elixir for economic growth…earnings growth…and share price growth.
So for as positive as recent economic news has been, for right now I expect a bit more time in the aforementioned trading range (4,337 to 4,600). And that time will likely be volatile with no seeming direction. That is the very nature of trading ranges.
All you have to do is keep your eyes on the long term horizon which is bullish which gives you ample reason to load up on the best stocks now for WHENVER the catalysts come to push them higher. Meaning don’t stay on the sidelines any longer. The time to get on the bull train is now.
The next section will discuss a bit more about which are the best investments to stay a step ahead of the pack.
What To Do Next?
Discover my current portfolio of 7 stocks packed to the brim with the outperforming benefits found in our POWR Ratings model.
Plus I have added 4 ETFs that are all in sectors well positioned to outpace the market in the weeks and months ahead.
This is all based on my 43 years of investing experience seeing bull markets…bear markets…and everything between.
If you are curious to learn more, and want to see these 11 hand selected trades, then please click the link below to get started now.
Steve Reitmeister’s Trading Plan & Top Picks >
Wishing you a world of investment success!
SPY shares . Year-to-date, SPY has gained 18.36%, versus a % rise in the benchmark S&P 500 index during the same period.
About the Author
Steve is better known to the StockNews audience as “Reity”. Not only is he the CEO of the firm, but he also shares his 40 years of investment experience in the Reitmeister Total Return portfolio. Learn more about Reity’s background, along with links to his most recent articles and stock picks.