Waiting For The DOW To Join The Party

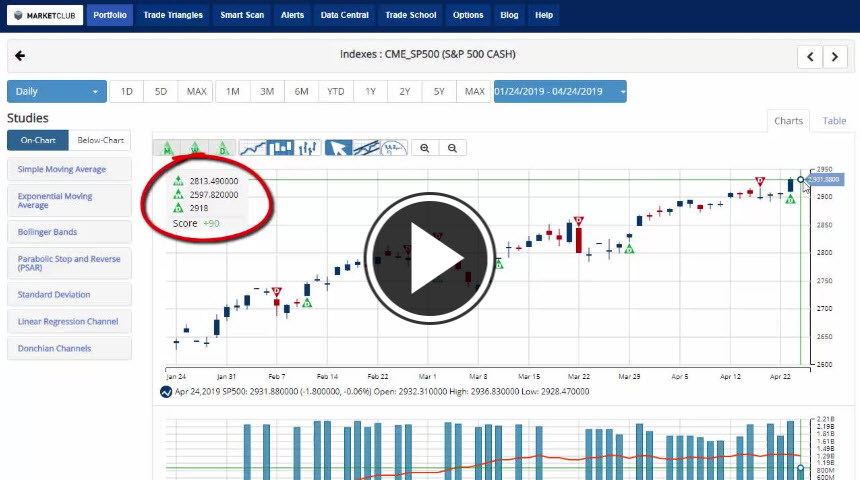
Hello traders everywhere. While the S&P 500 and NASDAQ have hit record highs in recent days the DOW is biding its time. Last week the DOW was within 255 points of hitting a new all-time high above 26,951.81 but failed to have any sort of follow through this week, now sitting roughly 300 points away. Will we get there this week? I'm not sure, but overall earnings season is turning out better than analysts had expected. Of the companies that have reported so far, 75% have beaten earnings estimates, according to FactSet. You would think that would be enough to push all three indexes to record levels.

DOW

The stock market got a boost after ADP and Moody's Analytics said private payrolls increased by 275,000 in April, easily blowing by a Dow Jones estimate of 177,000. The strong gain was led by an increase of 223,000 in payrolls within the services sector. Continue reading "Waiting For The DOW To Join The Party"

Market Stalls At The End Of Record Week

Hello traders everywhere. Stocks swung between small gains and losses Friday after figures showed the U.S. economy grew at a strong rate in the first quarter but the pace of consumer and business spending slowed. First-quarter gross domestic product was 3.2%, the Commerce Department said on Friday, topping the consensus economist estimate of 2.5%, according to Dow Jones. An increase in exports drove the increase. The better-than-expected print was driven by a rise in exports.

On a weekly level, the S&P 500 gained +.82% and was on track for another weekly advance. The S&P 500 sits just below Tuesday's record and is up 17% for the year. The Dow Jones Industrial Average also climbed 0.1% after entering the day 1.4% below last year's record but will finish the week in negative territory losing -.32%. The Nasdaq Composite dropped 0.1% and, as the S&P 500, was just below its record from earlier in the week and will post a weekly gain of +1.38%.

Crude oil prices

The U.S. dollar will back to back weekly gains with a gain of +.58% this week. Continue reading "Market Stalls At The End Of Record Week"

Stocks Struggle After Day Of Records

Hello traders everywhere. Stocks are struggling to gain footing in the positive territory a day after the S&P 500 and NASDAQ both posted record closes. The NASDAQ itself set a new intra-day day high of $8,139.55 before retreating into and out of negative territory on the day. The S&P 500 is just 0.3% away from an intra-day record high of 2,940.91 which it hit on Sept. 21, 2018, after surging about 17% this year.

The move higher came less than six months after a massive drop in December, which led to Wall Street's worst year since the financial crisis. But a pivot by the Federal Reserve in monetary policy away from higher rates and the cooling of trade tensions between China and the U.S. helped stocks rally from those lows.

Stocks Struggle

The DOW entered the day 0.6% below last October's all-time high but has failed to get out of negative territory today. There is still a slew of corporate earnings coming this week so look for the DOW to make a run at its own record high later this week. Continue reading "Stocks Struggle After Day Of Records"

Stocks Flat Ahead Of A Big Earnings Week

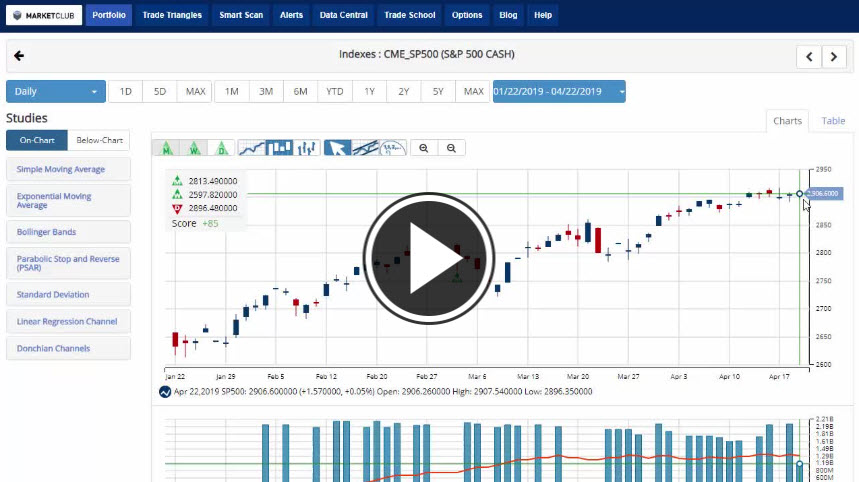
Hello traders everywhere. Stocks struggled Monday as Wall Street braced for the busiest week of the earnings season. The DOW fell 40 points, while the S&P 500 and NASDAQ were little changed.

More than 140 S&P 500 companies are scheduled to release their quarterly results this week, including Coca Cola (KO), Procter & Gamble (PG), United Technologies (UTX), Verizon (VZ), Twitter (TWTR), Lockheed Martin (LMT), and eBay (EBAY). Facebook (FB), Microsoft (MSFT), and Tesla (TSLA) Motors are also set to report later this week.

So far, the majority of corporate earnings reports have topped expectations. FactSet data shows 76.5% of the S&P 500 companies that have posted earnings have surpassed analyst estimates. Analysts came into the season with low expectations for the season, forecasting a 4.2% drop in profits.

crude oil

Crude oil is trading at it's highest levels since October of 2018 and is currently trading above $65 a barrel. The reason for the spike higher is that the United States demanded a cut off of Iranian oil exports to major importers like China and India who had been granted exemptions from sanctions, that statement rekindled fears that this by the U.S. could lead to a supply crunch. Continue reading "Stocks Flat Ahead Of A Big Earnings Week"

S&P 500: Drag & Drop?

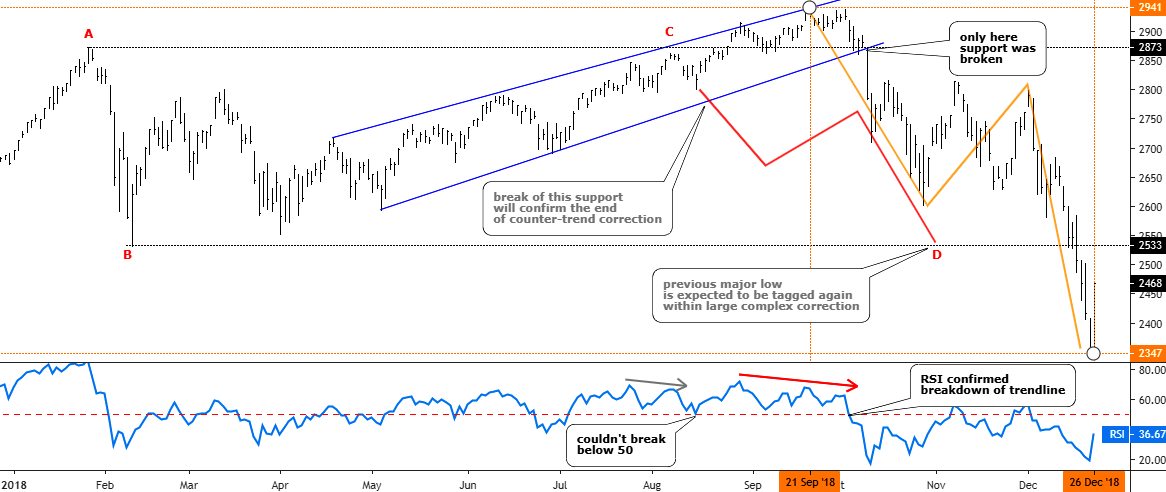
Last August I was thinking of the S&P 500 index and wondered if its uptrend had been exhausted on its way to the upside. The price was at the $2833 level, and it failed to break the earlier top of $2873. The RSI showed the Bearish divergence and the index started to drift lower. I thought it was a complex correction and another drop to hit the lower bound of the $2533-$2873 range was considered to be imminent. The majority of you supported this idea.

Let’s check the updated chart below to see what happened next.

Updated S&P Daily chart tailored in August 2018.

LLLL
Chart courtesy of tradingview.com

As we can see from the chart above the idea itself was good as the price not only retested but just smashed the so-called “bottom” of the range. The actual CD segment, which initially was thought to be equal to AB segment, had reached the ratio of 1.75 exceeding the next most common after 1:1 ratio of 1.618 (Fibonacci ratio) amid the panic sell-off. The trigger, which was set on the downside of the blue uptrend, was right as the index didn’t look back until the very bottom after it fell out of that blue uptrend. That move was accurately confirmed with a breakdown of the 50 level on the RSI sub-chart. The predicted zigzag structure of the drop also appeared to be correct as it is natural market behavior when one market stage changes the other. And talking about where we were right, I also would like to show you the ballot results on the timing of the bottom of the drop. Continue reading "S&P 500: Drag & Drop?"