Very Long-Term Silver

Just for fun because I am a chart guy who all too often bores you (and me) to death with ratio and indicator charts and all too seldom makes charts just for the fun of it anymore…

So this long-term silver chart is just for the fun of it. What do we have here?

  • A very long-term Cup & Handle; and boy what a handle. It killed the true believers years ago. I like that the 2011 (bubble) right side high is higher than the 1980 (bubble) left side high (monthly closing basis).
  • A price that has held a very long-term support level at 14, coinciding with a 79% Fib retrace (if you believe Fibs are relevant).
  • Vertical cycle lines spaced around 8 years apart that have marked the two bubble highs, a minor high in the late 80s that led to a years-long trough, a whole lot of nothing in the mid-90s and the start of a massive bull market in 2003. The current line would appear to be a marker to a low.
  • Yes, that thing from 2006 to today looks like an ugly Head & Shoulders pattern, so let’s give it its due as well. If I am wrong about an inflationary near future – and the Gold/Silver ratio still stands in defiance of an inflation trade on this day – you’d want to at least be aware of the bear’s potential.
  • Another thing I don’t care for is the decade long trough that sprung the 2003 bull market vs. the much shorter flat period leading to today. Silver has certainly not had that level of desolation to its investment landscape since the most recent bubble popped in 2011.

So okay, there are at least two caution points if you want to take the long-term chart seriously.

That said, nothing’s changed. I am bullish on silver at this time and prepared to get more bullish if/when it takes over for gold. But obviously, that very important support around 14 that silver twice tested in the last year and three times tested in the last 5 needs to hold. Continue reading "Very Long-Term Silver"

Gold Takes Off, Silver To Follow?

In the middle of May, I questioned if the Head & Shoulders pattern, that was detected in April was still intact. Most of you agreed that there was enough evidence to drop that bearish idea, moreover, the new Bull Flag pattern was spotted on the weekly master chart.

Besides that, one of the readers kindly enriched our view, noticing another bullish Cup & Handel pattern that supported the upside expectation.

Last Friday, the gold took off its upside journey as the Bull Flag was breached to the North as price finally moved beyond the $1300 handle and overcame the minor top established on the 14th of May. The targets were set before, let’s hope for the best!

But what about silver? Last time I wrote about it in January using experimental clones from history. This metal had an ugly chart structure as gold had a clearer one. But no matter how the market tries to confuse us sooner or later we will see the end anyway. Again silver has been a laggard behind gold, and the latter gives us a clue as it broke up the resistance.

Let’s see, in the chart below if we can find gold’s shining in the silver market. Continue reading "Gold Takes Off, Silver To Follow?"

Gold Bullhorns Quieted For A Day, At Least

Over in the gold patch, things went from disinterested and downright antagonistic (A Notable Lack of Interest in Gold) to sleepy (Gold “Community” Crickets) to ferociously over bullish.

Any long-time and right-minded gold bug will tell you that the latter condition is usually a signal to prepare for some turbulence. Wednesday and Thursday brought the turbulence in the form of a reversal and pullback for gold, silver and the miners.

Since we became constructive on the gold sector in Q4 2018 (per the links above and especially NFTRH reports/updates) the groundswell of gold boosting (pom poms and all) has steadily risen since it became obvious that something bullish was going on in January. And it appears that last week’s breakout from various daily chart bull flags in gold, silver and the miners finally jerked ’em all in. Enter the Thursday pullback.

In the very few days immediately before that $20/oz. pullback the gold “community” threw itself a gathering of the bullish clans. On just a quick look around the gold websites, some quotes popped out from 2 days before the pullback and one day before Wednesday’s reversal. It’s crickets no more… Continue reading "Gold Bullhorns Quieted For A Day, At Least"

A Precious Metals Update

I reserve most of the work on precious metals for NFTRH weekly reports and in-week updates because it is done on a consistent basis, with the work done previously key to the narrative making sense in real time and going forward. In other words, in order to not be out there stabbing in the dark, you need to have an ongoing, adjustable plan that makes sense at all times with the macro markets around it.

So that said, let’s take a snapshot of where things stand currently with the understanding that this work will need future updates, which will probably not be made publicly. It is up to the reader to do the work required to put context to the picture. Meanwhile, this will free up more space in next week’s NFTRH 538 to focus on some quality miner charts, which sometimes take a back seat to the macro/sector stuff.

Precious Metals Update

First off, Commitments of Traders data are only available through 12.31.18 as a result of the government shutdown. So we are flying somewhat blind from that perspective. At the end of December, the CoT for gold and silver were well on their way to a bearish alignment. Have they maxed their trends and reversed in the meantime? It is quite possible, especially since the metals have taken pullbacks (within their intermediate uptrends) recently.

We have been following an analog to 2001, which saw SPX break down below its 50 & 200 day moving averages as HUI began its bull market. What’s more, SPX then tested its breakdown in Q1 2001… Continue reading "A Precious Metals Update"

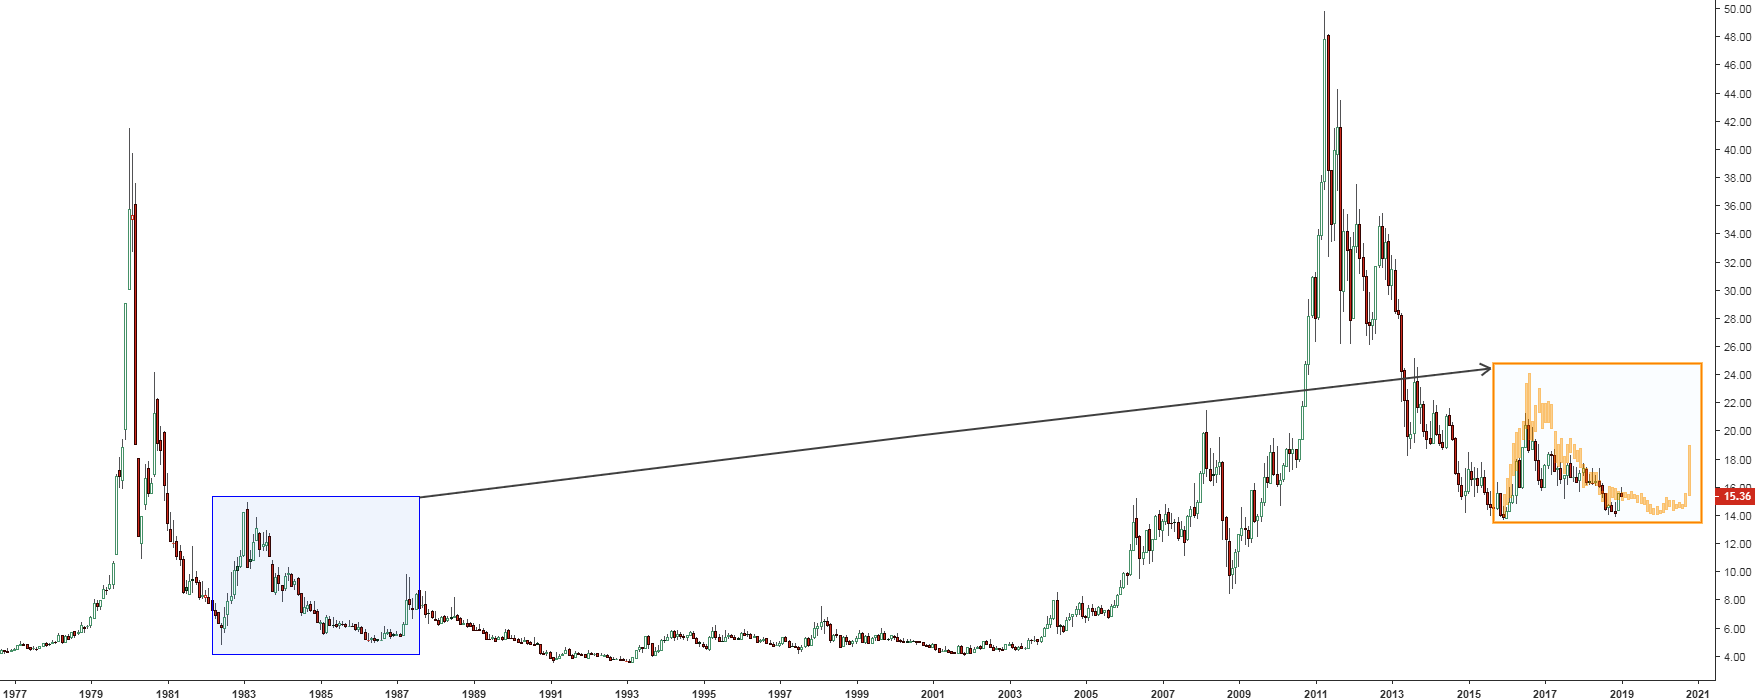
Silver Update: 1980s Vs. The 2010s

Silver surprised us with a strong Santa Claus Rally. It woke up like an ancient volcano and with a booming eruption. Before that, we proclaimed silver to be dormant compared to a vigorous rival, gold.

Everything changed at the end of 2018 as gold gained 10% from the lows and a weak silver tried to catch up to make the same profit at the very end. Bargain hunters couldn’t pass by this clear market distortion and took their chance to book a nice profit of around 4%.

In my earlier post I updated the medium term gold chart for you. Last time I updated the big chart of silver in October, which was titled dramatically “Fly Or Die” as submissive behavior of silver was leaving less and less hope for investors.

This time I am going to update the silver chart, but using a different approach. You are already familiar with it as I used historical clones with gold and silver before. The latter one was successful. This time it will be extended as I will use two clones instead of one from different historical periods so you can choose.

Let’s start with the distant one.

Chart 1. Silver Futures Monthly: Echo Of the 80s

Silver Update
Chart courtesy of tradingview.com

This chart was built in a high resolution, and I recommend you to click on it to open in a new window to see a larger image in details, especially in the right clone (orange box). Continue reading "Silver Update: 1980s Vs. The 2010s"