Gold, Silver, Gold/Silver Ratio & HUI

Precious metals are still locked down. With an understanding that there is always much more in play than nominal charts (the macro & sector fundamentals for example, which bounced of late but never did definitively flip positive), let’s review said nominal charts of gold, silver, and HUI along with an update of the Gold/Silver ratio for good measure.

Meanwhile, we will continue to update the full spectrum of considerations for a positive view of the precious metals complex, including gold’s standing vs. cyclical, risk-on markets/assets, the state of speculative vs. quality credit spreads, the inflationary backdrop (despite promotions to the contrary, cyclical inflation is not beneficial to the gold mining industry), the seasonal averages and the charts of the metals and miners over various time frames in NFTRH.

Gold

The daily chart shows the gold price (futures) below the moving averages but above short-term support after failing – amid much personally observed cheerleading to the contrary – to cross the bull gateway at 1920.

As a side note, the broken blue downtrend channel on this daily chart is actually the Handle to a large and bullish big picture Cup that only has one thing going against it that I can see; too much exposure by too many TAs, which of course means it may not be expressed until many of those TAs recant their stories (we have noted all along that the Handle can drop all the way to the 1500s without damaging the 2022 bullish Cup story. Indeed, if it were to happen (not predicting folks, but being prepared) it would be healthy. There is nothing healthier than a good running of the bugs before a major bull move. Continue reading "Gold, Silver, Gold/Silver Ratio & HUI"

Metals Ratios Continue To Indicate Inflation

And that is welcome for monetary and fiscal policymakers of course since inflation is the only trick they have up their sleeve to bail this mess out once again. And this is no comment on COVID-19. The economy was slowly decelerating last year well before COVID-19 showed up.

The yield curve bottomed and turned up in August of 2019 as manufacturing was slipping, long-term yields were tanking and other economic signals were fraying in the wake of the trade war. So please, no convenient COVID excuses.

See: Yield Curve Hits New 2019 Steepener Today

They were preparing to inflate because the Continuum told them to prepare. COVID-19 dropped the final hammer on the situation and brought the inflation on quicker and more intensely than might have otherwise been the case.

30 year yield

So anyway, on to the lovable Amigos. Continue reading "Metals Ratios Continue To Indicate Inflation"

Silver Begins Big Upside Rally Attempt

The move we saw in Silver early this week to new 6-year high price levels, above $22.60, is quite likely the biggest upside move in Silver since the bottom in March 2020 – after the US stock market collapsed because of the COVID-19 virus event. This new rally in Silver is likely the move we’ve been suggesting to our followers relating to a series of measured upside price moves totaling approximately $5.30 in each advance.

As traders, watching bonds accelerate moderately higher as the US Dollar falls and the stock market attempts new lofty levels, we are intrigued by the move in metals because it suggests a large segment of investors believe a bubble is nearing very peak valuation levels. The only reason metals, particularly Silver, would be accelerating as it has recently is that traders have suddenly adopted a stronger demand for second-stage hedging of risk.

Gold is the traditional hedge for many traders in times of risk. Silver, being the second-tier hedge, typically start to rally 4 to 6+ months after Gold begins to move substantially higher. Gold is currently trading near all-time highs – near $1820. Silver just recently bottomed in March 2020 near $11.65 and has rallied more than 70% to current levels – above $20.35. If our research is correct, Silver will rally to levels above $26 within this current upside rally.

The multiple measured moves in Gold and Silver suggest waves of price advances happen in a series of structured upside price moves. We believe this current upside move in Silver will push price levels above $26 per ounce. If Gold continues to rally as Silver rallies, then future measured moves should target $31.50 and $36.75 in Silver – possibly higher. Continue reading "Silver Begins Big Upside Rally Attempt"

Is Gold Poised To Move Higher?

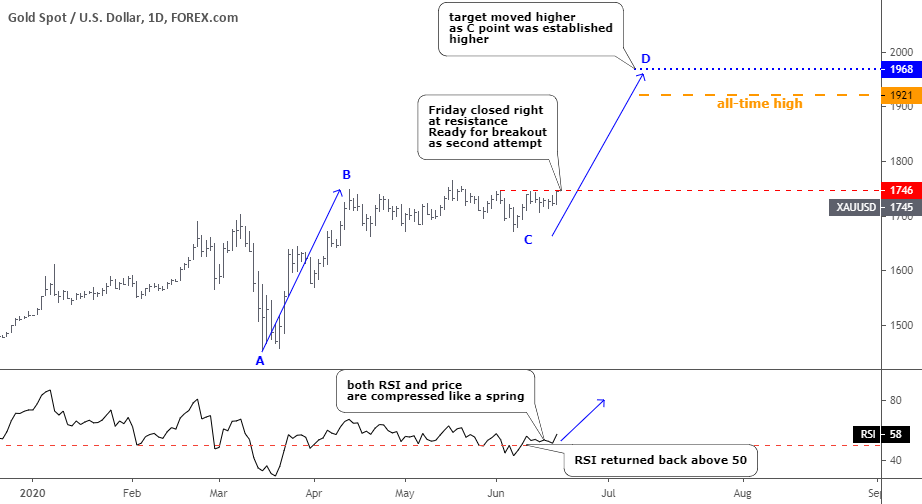
Polls show that you were optimistic about the probability of another rally for top metals. Both of them go well with the maps that I shared earlier this month. Let's see, in the updated charts below if they are going to justify your bold expectations.

Gold is the first as it has a stronger position now.

Gold
Chart courtesy of tradingview.com

The top metal completed the sideways consolidation that I showed you two weeks ago. It didn't touch the 38.2% Fibonacci retracement level at $1636 as it stopped at $1671, which is even higher than the first leg of this corrective structure, which was established at $1661. It is an entirely natural outcome as the last leg down started at $1766, also higher than the top of the first leg did at $1748. The second leg down was longer ($95) than the first leg ($87). Continue reading "Is Gold Poised To Move Higher?"

Gold Falls As Silver Misses Target

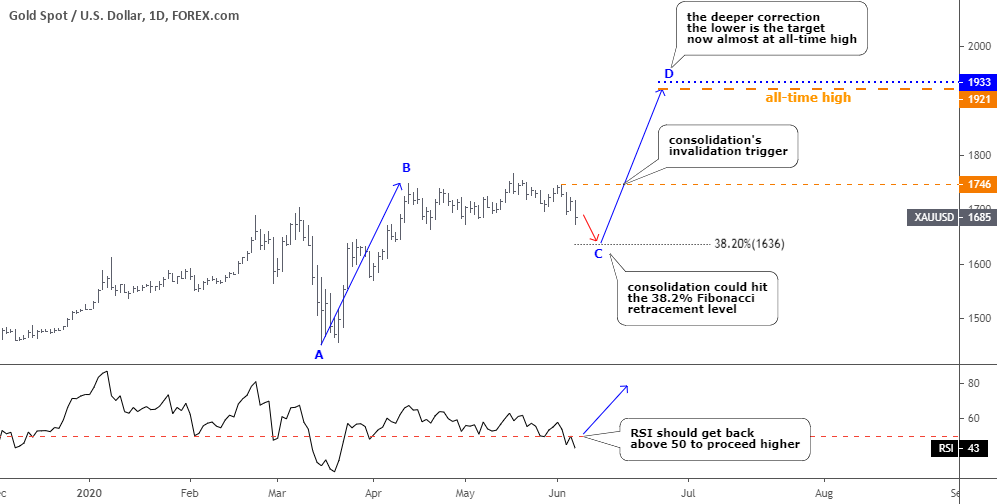
Both top metals couldn’t sustain the growth, although silver was more convincing than gold this time again.

Let’s start with the updated gold chart below.

gold
Chart courtesy of tradingview.com

Gold is still consolidating as it couldn’t overcome not only the nearest peak of $1766 but it also failed right at the top of the AB segment of $1748. The RSI dipped into the bearish zone below the crucial 50 level. So, it’s the right time to put our classic instrument called Fibonacci retracement level as gold watches ground while both feet are in the air. The first important 38.2% Fibonacci retracement level could offer support at $1636. Continue reading "Gold Falls As Silver Misses Target"