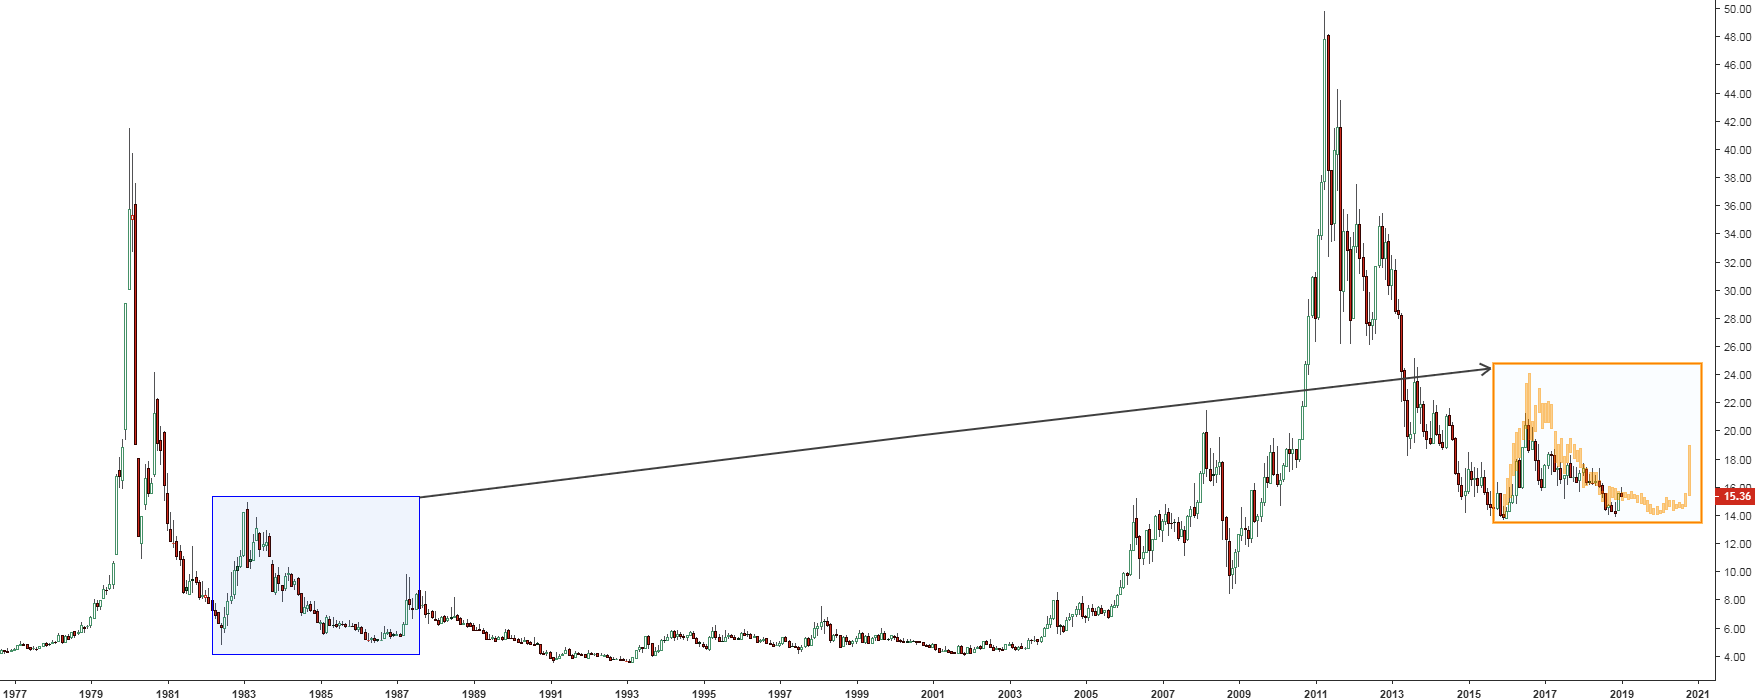
Earlier this August, I shared with you the map for silver with three possible options of how the price could emerge. I labeled them with three different colors for you to distinguish them easily.
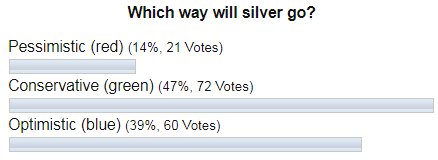
Let’s see below how did you vote for the future of the silver price.

I didn’t doubt that the “Pessimistic” (red) scenario would be the least liked option as silver bears are rare these days amid the powerful bullish move in the metal’s price, that had preceded the ballot. The polar “Optimistic” (blue) scenario, which implied the non-stop move of the silver price to the upside to tag the former top of $21.13, ranked second. Indeed, it was a close call as the poor man's gold, surprisingly rocketed in a week after the post to hit the multi-year maximum at the $19.65. It could be a winning stake, but right after that the price dropped hard to close the first week of September below $18. And here comes the accurate prediction, that was picked by the majority as you had chosen the “Conservative” (green) scenario, which implied the setback of the price ahead of the final home run. Again, it was an amazingly prophetic call, thanks for sharing your votes with all of us here on the Blog.
I updated the map for you in the weekly silver chart below, let’s have a look there. Continue reading "Silver Update: This Setback Could Be A Takeoff Roll"


