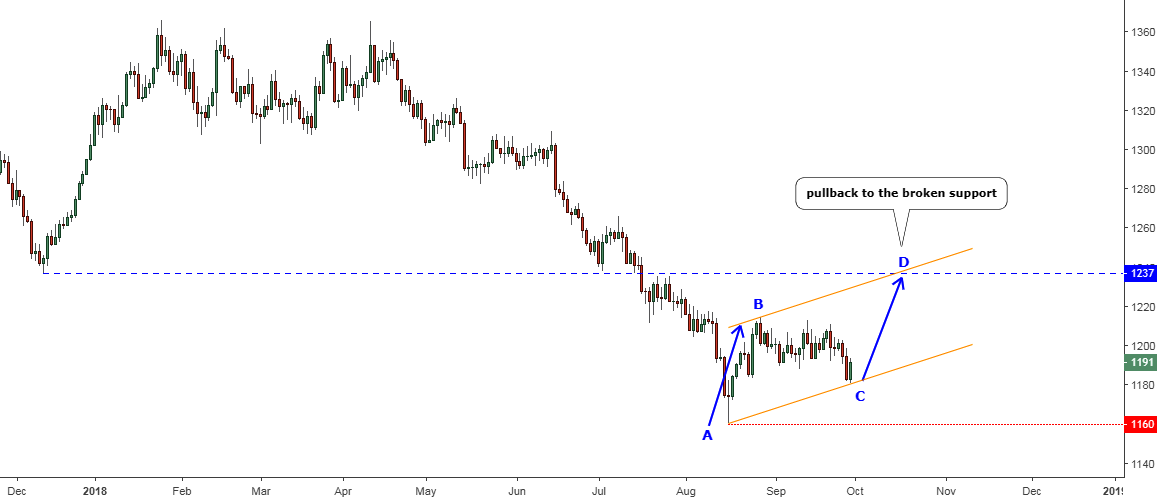
Chart 1. Gold Daily: Former Support Retested, Another Spike Is Possible
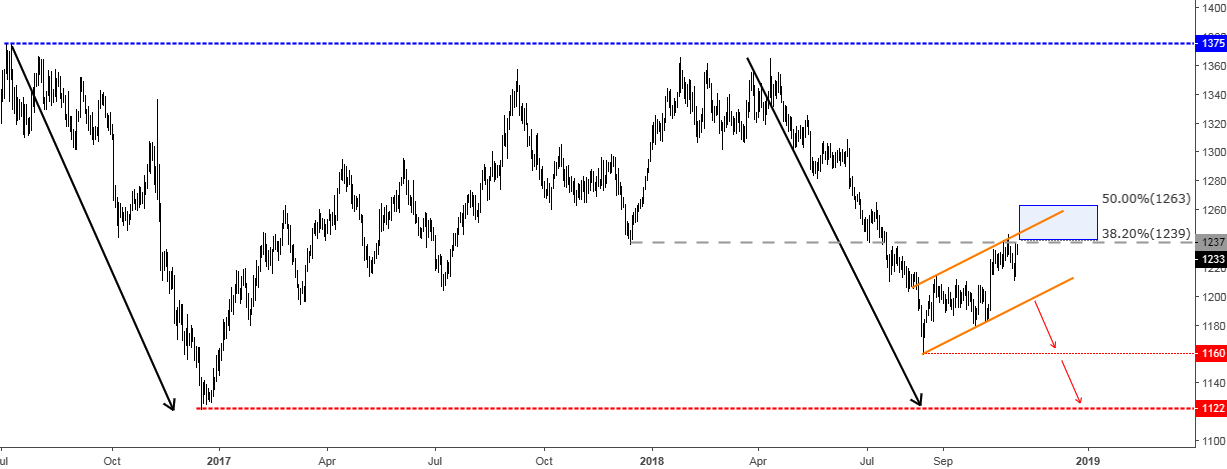
Chart courtesy of tradingview.com
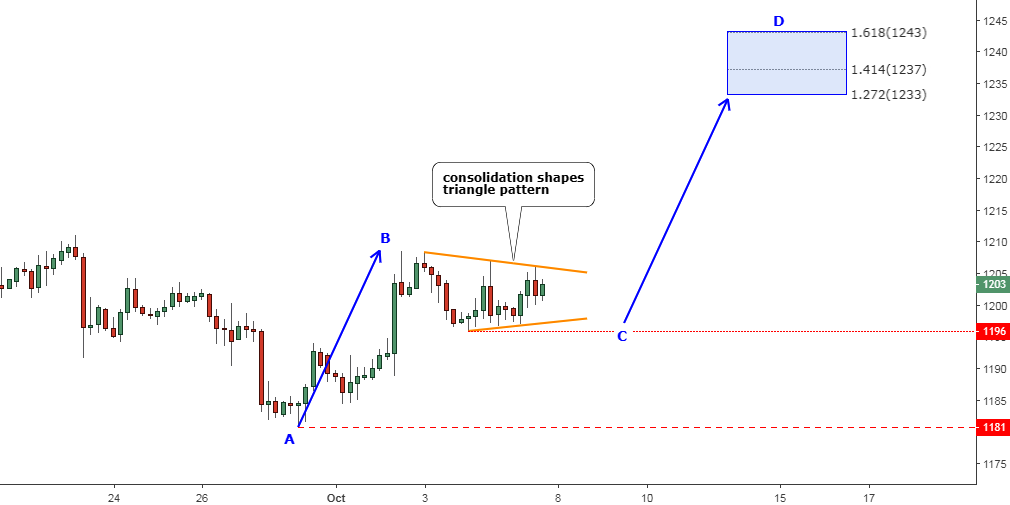
Gold has finally reached both the AB/CD target and the former support area of $1237 (gray dashed line) as it was forecasted last month in this chart. The metal hit the maximum of $1243 on the 26th of October and then dropped like a rock as was also anticipated after the completion of a pullback. Last Wednesday the price established a low of $1212 losing $31 (-2.5%) from the top. But at the end of last week, gold restored almost all of its losses, closing just below the former support at $1233.
Continue reading "Silver Slows Saving Gold From Collapse"

