Precious Metals: Where Do They Go From Here?

When I see such situations in the market as we witnessed in precious metals lately, I think about two trading mantras. The first one says, “any profit is a profit,” aka “lose chances, not money,” and the second is “corrections are tricky.”

Both metals’ charts started to play out precisely as per the structure that was shown in my previous update, and I am very grateful as you supported my view with an overwhelming majority of voters. Indeed, it paid well, although the depth of the first leg down was just devastating as it exceeded the preset range.

Usually, the first legs are so strong and sudden as they trigger panic in the market. Although I expected this move weeks ahead, when it plays out, you’re never emotionally ready for such a storm as it literally could have no boundaries. The fear had it all. Some traders think they could sit through such enormous volatility. I doubt that risk management/capital/margin could allow it as gold lost more than 10% from the top to the bottom of the first leg while silver has been smashed, losing 22%.

The dust is quietly settling down after that fall, and we can adjust the plan. Let’s start with gold’s daily chart.
Precious Metals
Chart courtesy of tradingview.com

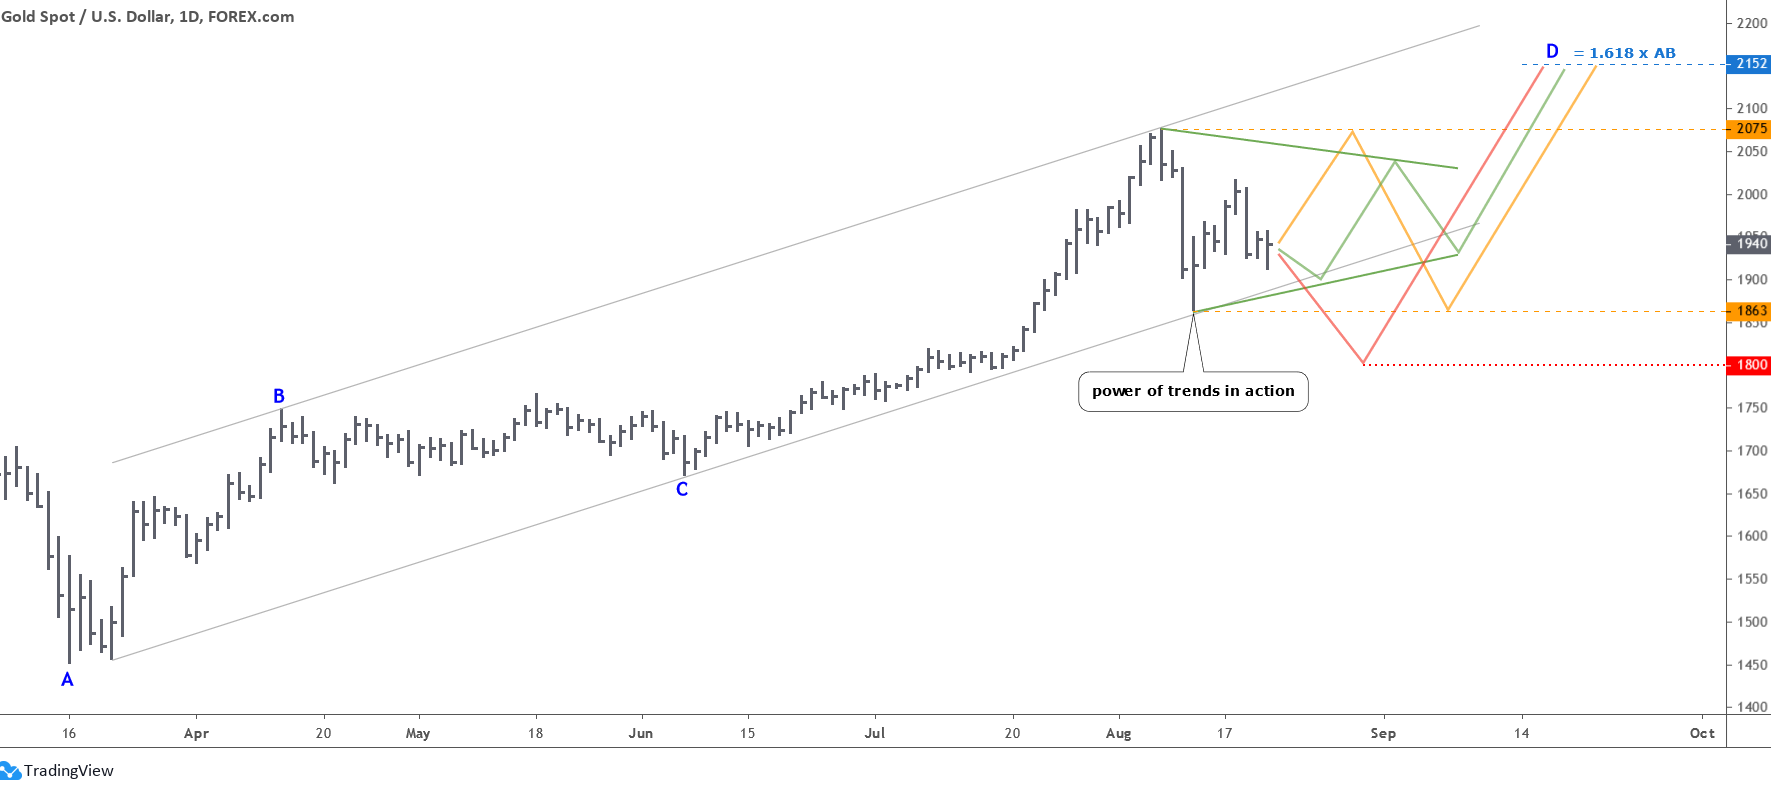
Again and again, we witness the real power of the trends as the “falling knife” of the first leg down was successfully rejected with the downside of the trend channel (gray). The price bounced off so hard that it retraced more than 60 percent of the preceding drop. Then it lost more than 60 percent again, but of the rise. If it continues to make such seesaw moves within a contracting range, then we will see a Triangle pattern shaping on the chart. I highlighted that option with a green color. I put two converging trendlines with almost ideal angles of a triangle, but the real path could differ, although the model should remain intact. The break above the last peak will trigger the upside move. Continue reading "Precious Metals: Where Do They Go From Here?"

Precious Metals Warn Of Increased Volatility

Are the precious metals patterns predicting a big downside price event?

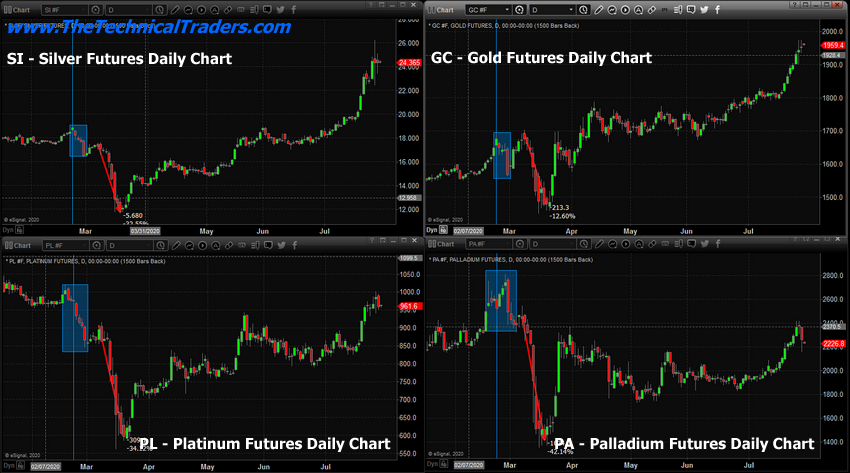
Our trading team witnessed a big drop in Platinum and Palladium prices early this morning while Gold and Silver continued to push moderately higher. We began to question this move and investigate any historical relevance to previous patterns. Our research team pointed out that both Platinum and Palladium rolled lower just 3 to 4 days before the breakdown in the US stock markets on February 24, 2020, while Gold and Silver were reaching recent price peaks. Could the patterns in precious metals be a warning of another potential volatility spike and price decline in the near future?

Our research team created the charts below to help highlight the pattern that we are seeing in Precious Metals right now. First, we highlighted February 24, 2020, with a light blue vertical line to more clearly illustrate where the markets initiated the COVID-19 breakdown event. Next, we drew shaded rectangles around new downside price rotation levels that took place near this peak in the US stock markets. Lastly, we drew a red line that highlights the subsequent price decline that took place in Precious Metals as the markets tanked in late February and early March 2020.

Precious Metals

The current downside price move in Platinum and Palladium are very interesting because it appears Platinum and Palladium both initiated a downside/contraction price event just 3 to 4 days before Gold and Silver, as well as the rest of the US stock market, began to collapse on February 25, 2020. You can clearly see in the bottom two charts that Platinum and Palladium initiated a downside price correction a few days before both Gold and Silver reached their peak levels and began to move lower. Once this peak rotation took place, all four of the major metals groups moved moderately lower for about 7 days before pausing, then collapsed even further. Continue reading "Precious Metals Warn Of Increased Volatility"

Is Gold Poised To Move Higher?

Polls show that you were optimistic about the probability of another rally for top metals. Both of them go well with the maps that I shared earlier this month. Let's see, in the updated charts below if they are going to justify your bold expectations.

Gold is the first as it has a stronger position now.

Gold
Chart courtesy of tradingview.com

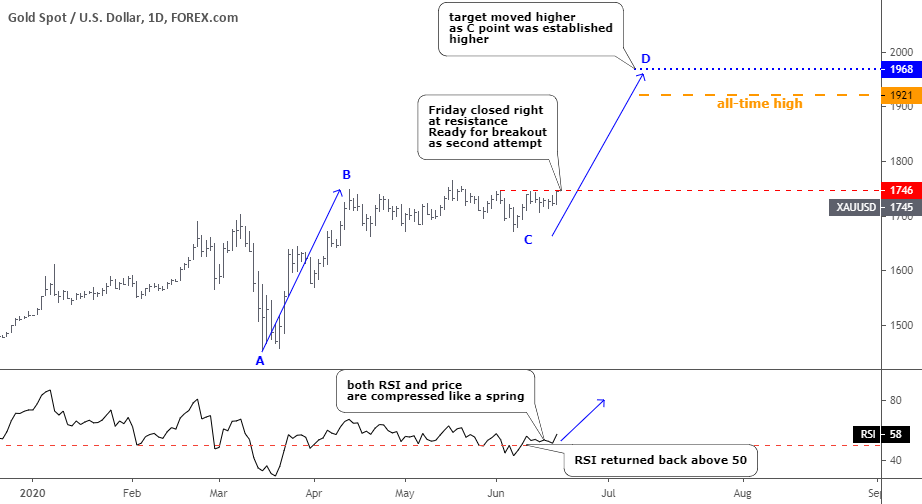
The top metal completed the sideways consolidation that I showed you two weeks ago. It didn't touch the 38.2% Fibonacci retracement level at $1636 as it stopped at $1671, which is even higher than the first leg of this corrective structure, which was established at $1661. It is an entirely natural outcome as the last leg down started at $1766, also higher than the top of the first leg did at $1748. The second leg down was longer ($95) than the first leg ($87). Continue reading "Is Gold Poised To Move Higher?"

Gold Falls As Silver Misses Target

Both top metals couldn’t sustain the growth, although silver was more convincing than gold this time again.

Let’s start with the updated gold chart below.

gold
Chart courtesy of tradingview.com

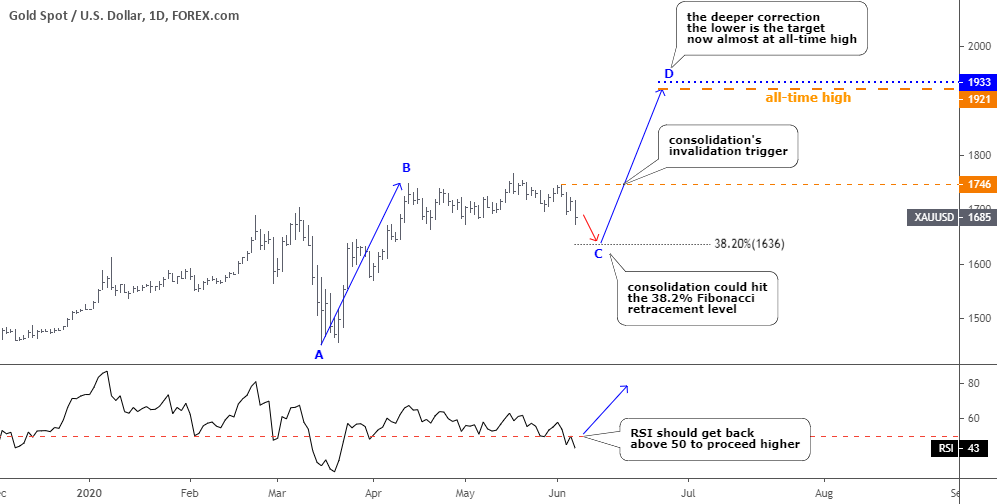
Gold is still consolidating as it couldn’t overcome not only the nearest peak of $1766 but it also failed right at the top of the AB segment of $1748. The RSI dipped into the bearish zone below the crucial 50 level. So, it’s the right time to put our classic instrument called Fibonacci retracement level as gold watches ground while both feet are in the air. The first important 38.2% Fibonacci retracement level could offer support at $1636. Continue reading "Gold Falls As Silver Misses Target"

Are Palladium, Gold And Silver Set To Takeoff?

In this post, I'll go over the charts for palladium, gold and silver, but first I would like to start with palladium futures as it has the most potential gain to reach this round. At the start of May, I shared with you the map with equal opportunities for this champion metal to either break up or down. Here is how you saw the future for palladium in the graph below.

Palladium Poll

The majority chose the “break down” option, although with a minor advantage, but this bet played out as the metal’s price dipped one more time in the third leg down of a large correction. You were right again!

Now, let’s get down to the hot opportunity that I spotted for you on the palladium futures daily chart as it’s worth watching on the Gold & Silver Primetime.

Palladium Gold Silver
Chart courtesy of tradingview.com

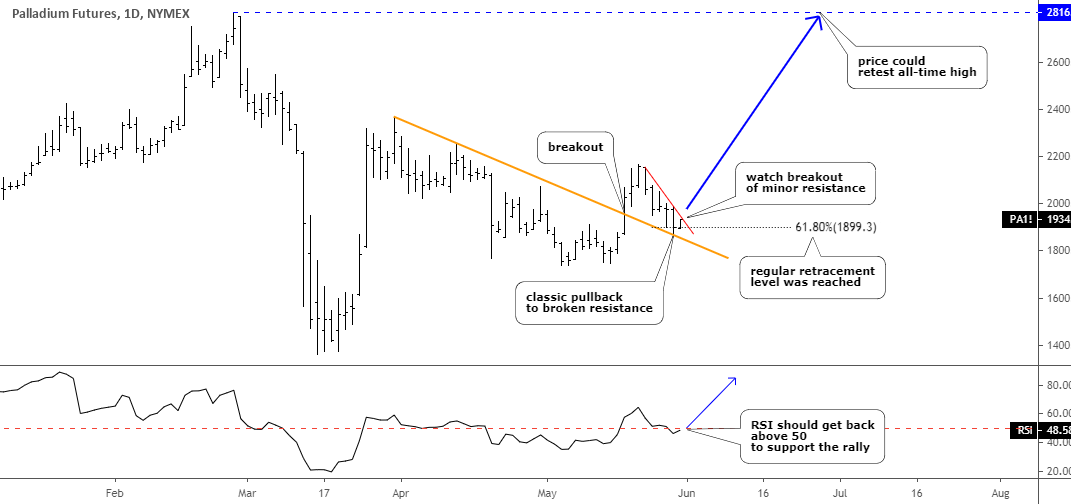
The chart structure of palladium futures on the daily time frame could indeed be posted in the trading textbook as it is neat and smooth. I put detailed explanations here and on the chart as this metal gives such an excellent opportunity for education. Continue reading "Are Palladium, Gold And Silver Set To Takeoff?"