Some Are Expecting "Rolling Brownouts" Or "Blackouts"

“The following is an excerpt from Tim Snyder’s “Weekly Quick Facts” newsletter. Tim is an accomplished economist with a deep understanding of applied economics in energy. We encourage you to visit Matador Economics and learn more about Tim. While there, you can sign up for his completely free Daily Energy Briefs and Weekly Quick Facts newsletters.”

Brownouts and blackouts are terms that describe the gradient of power loss, from limited in scale and time and transitioning to total darkness, with no idea of when the loss of power will subside. Valentine’s Day week 2021, Texans were told that ERCOT had not prepared for the deep cold that centered on Texas, and reserves for fueling power plants either were stuck in frozen pipes or just were not available. As a result, 151 people lost their lives due to exposure or other related effects of that storm.

This week, as we begin the first full week of June, we hear those same words, but this time we’re hearing them for the entire country. We all are asking how can we be here again and when will it happen? We’ll address these today in this article.

Let’s start with some perspective. On January 1, 2020, the futures price for Natural Gas was $2.1890 per MMBtu (million Btu). President Biden took office on January 20, 2021, and the price for Natural Gas was $2.5460 per MMBtu. On January 1, 2022, the futures price for Natural Gas was 3.7300 per MMBtu, and Tuesday’s closing price for Natural Gas was $9.293 per MMBtu.

Let’s look at a graph: Continue reading "Some Are Expecting "Rolling Brownouts" Or "Blackouts""

And You Thought Gasoline And Diesel Prices Were High

“The following is an excerpt from Tim Snyder’s “Weekly Quick Facts” newsletter. Tim is an accomplished economist with a deep understanding of applied economics in energy. We encourage you to visit Matador Economics and learn more about Tim. While there, you can sign up for his completely free Daily Energy Briefs and Weekly Quick Facts newsletters.”

I was asked last week, after our series on gasoline and diesel prices and how high those prices could go, my thoughts on the price of Natural Gas, and where they could go.

I have been following Natural Gas prices and Natural Gas inventories for years, so I went to my trusty charts and began to piece together a narrative.

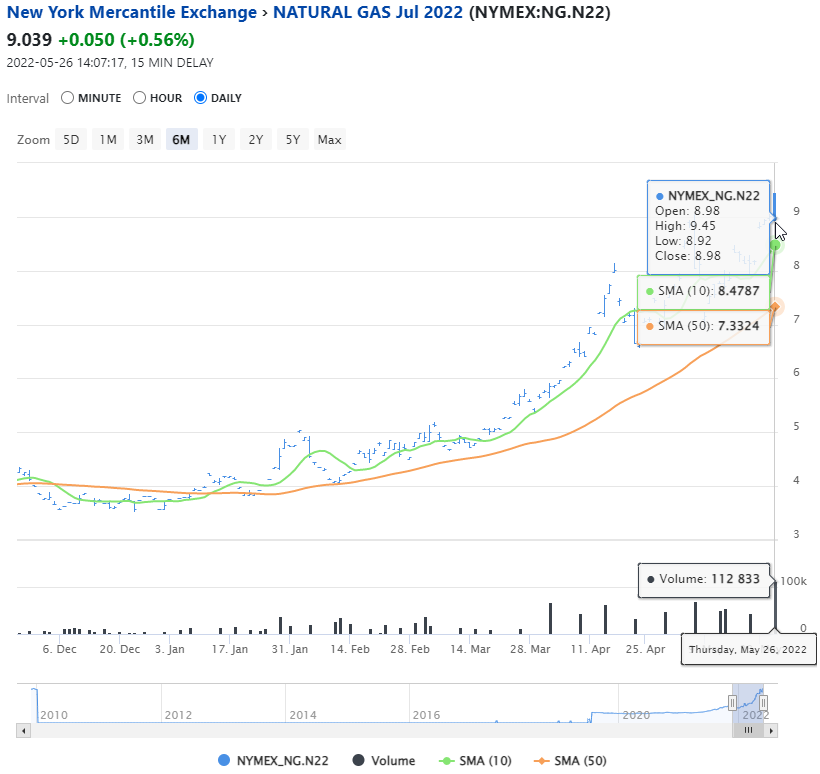
Just this year alone, the price of Natural Gas has doubled. We started the year at $3.73 per million cubic feet (MMCF) and closed business yesterday, at $8.796 per MMCF. Here’s that
price chart:

Natural Gas Futures

I also looked at the inventory chart for Natural Gas from the Energy Information Agency. That chart showed me that natural gas inventories are starting to trend toward the lower end of the five-year average. Continue reading "And You Thought Gasoline And Diesel Prices Were High"

Natural Gas ETFs Took A Wild Swing In September

In September, the price of natural gas fluctuated more than we had seen since February of this year and it's likely that while some investors made vast sums of money, others lost just as much, if not more. But what made September so crazy was that natural gas made a significant reversal right in the middle of the month.

The price of the United State Natural Gas ETF (UNG) ended the month of August at $23.95 and closed at $24.83 on the last trading day of September. That move represents a 3.6% increase, not an insignificant amount but also not making anyone piles of money. But, while the price of natural gas started the month at $23.95, its lowest closing price for the month came on September 14, where it bottomed out at $22.69. Had you been watching the price, recognized this was the bottom and bought on September 14 or 15, you could have made yourself a nice 9.4% gain (the gain would be higher if you continued to hold for a few days at the beginning of October).

Again though, a 9% gain is a good return, but not necessarily what I would call “rolling in the dough.”

In order to make that kind of money, you would have had to use leverage. If you had purchased shares of the VelocityShares 3X Long Natural Gas ETN (UGAZ) at the close of September 14 and sold them at the close on September 28, you would have made a sweet profit of 30%. (Again, this would have been even larger, upwards of 50% if you held onto your UGAZ the first few days of October.)

Why did UGAZ perform so much better than UNG? Well, that is because UGAZ is three times leveraged natural gas fund, meaning it gives your three times the return of natural gas if the commodity moves higher. The flip side of that is you can lose three times the amount of money if natural gas prices fall while you hold the shares. Continue reading "Natural Gas ETFs Took A Wild Swing In September"

How To Profit From Natural Gas's Monster Uptrend

By: David Goodboy of StreetAuthority.com

I love finding stealth rallies in the financial markets. These under-the-radar moves higher are ignored by the financial media and therefore by most investors.

Stealth rallies occur for any number of reasons. Primarily, these types of upward moves happen in commodities or stocks that have been beaten down for so long that the public simply loses interest in them.

A stealth rally starts by attracting the attention of only the most die-hard followers. These early investors quietly pocket huge gains while the rest of the investment community is chasing the latest hot stocks or futures.

Right now, a stealth rally is taking place in a commodity that has not been in the headlines for a while. Once a darling of the financial media, this commodity has been beaten down so severely it is rarely mentioned in the daily financial press. After being hailed as the savior of the United States' energy future, this commodity quickly became over-produced. It may have succeeded in revitalizing U.S. energy, but its price continued to plunge lower as the years passed.

In case you haven't guessed it, I am referencing natural gas. The widespread use of fracking created an oversupply of the commodity, resulting in a price plunge.

Recently, however, things have changed. Natural gas is in the middle of a monster upward rally and it's not too late to jump on board.

Allow me to explain. Continue reading "How To Profit From Natural Gas's Monster Uptrend"

How The Natural Gas Storage Glut Has Been Cut This Summer

Robert Boslego - INO.com Contributor - Energies


The National Oceanic and Atmospheric Administration (NOAA) reports cooling degree day (CDD) data for every seven-day period by state. From that data, they construct a populated-weighted national total.

CDDs are the difference between the daily temperature mean (high temperature plus low temperature divided by two) and 65°F. If the temperature mean is above 65°F, we subtract 65 from the mean.

Example: The high temperature for a particular day was 90°F and the low temperature was 66°F. The temperature mean for that day was: Continue reading "How The Natural Gas Storage Glut Has Been Cut This Summer"