Chart Spotlight: Tesla (TSLA)

Shares of Tesla (TSLA) just split 3:1 and now trades around $300 a share.

From here, the EV stock could accelerate well above $900 again, near-term - all thanks to substantial catalysts.

According to MarketClub, the short- and intermediate-trends are positive. The RSI, Fast Stochastics, and Williams’ %R are all pivoting well off recent lows.

TSLA Chart With Trade Triangles

Source: MarketClub

Electric vehicle demand is only accelerating. Not only do global leaders want millions of EVs on the road, California is about to prohibit the sale of gas-powered cars.

In fact, “The rule, issued by the California Air Resources Board, will require that 100 percent of all new cars sold in the state by 2035 be free of the fossil fuel emissions chiefly responsible for warming the planet, up from 12 percent today. It sets interim targets requiring that 35 percent of new passenger vehicles sold in the state by 2026 produce zero emissions. That would climb to 68 percent by 2030,” according to The New York Times.

Historically, investors love TSLA stock splits. The last time TSLA split – in August 2020 – the stock price surged 60% from the day of the announcement until its execution. Continue reading "Chart Spotlight: Tesla (TSLA)"

Chart Spotlight: Canadian Solar (CSIQ)

Over the last few weeks, I highlighted a few opportunities with Chart Spotlight.

  • On July 13, for example, I highlighted Generac Holdings (GNRC), as it traded around $212. It’s now up to $265.50.
  • On July 26, I highlighted Albemarle (ALB), as it traded at $224. It’s now up to $280.15.
  • On August 3, I highlighted Marathon Digital Holdings (MARA), as it traded around $13. It’s now up to $15.26, and could still move higher with Bitcoin.
  • On August 5, I spoke about Tellurian (TELL), as it traded at $3.15. It’s now at $4.35.

With the help of the screeners at MarketClub, that’s not bad at all.

Today, I'm taking a look at solar stocks, like Canadian Solar (CSIQ), which MarketClub is rating with a strong +100. Not only is this an indication of a strong long-term trend, it’s also telling us the intermediate and short-term trend is up for CSIQ, as well.

In fact according to the Chart Analysis Score, at a +100, CSIQ is in a strong uptrend that is likely to continue. With short-term, intermediate, and long-term bullish momentum, CSIQ continues to climb. MarketClub's most recent green monthly Trade Triangle occurred on August 5 at $38.18.

CSIQ Chart With Trade Triangles

Source: MarketClub

Continue reading "Chart Spotlight: Canadian Solar (CSIQ)"

Sneak Peek: Bear Market '22

Every month, I release a new video for MarketClub members...

I cover everything from current market conditions and trading lessons learned (good and bad), to stocks on my watch list, questions I receive from members, and more.

Here is a sneak peek of my August Bonus Training Video.

Today’s theme is Bear Market ’22... shocker right?! Well, this one is a good one and I’m going to cover a lot so let’s jump in!

The good news is, we’re in a solid bear market rally and just flashed a monthly Trade Triangle in the big 3! I’ll look back at past bear market rallies and show you how the Trade Triangles have been an excellent indicator of changes and traps in the past (including getting you out before a 20% pullback in the most recent bear market). I’ll show you what I’m looking at and what to be cautious of.

Now full disclosure, even though we’ve seen these new Triangles issued, my gut tells me we haven’t seen the end of this bear market. But guess what? THE MARKET DOESNT CARE WHAT I THINK, so I trade what the market and signals tell me.

So, today we’ll do something we haven’t done in a while, look through some charts and scan for some trades! After all, the market is going up and as we’ve seen already the signals rarely, if ever, let us down!

I’ll break down the Top Options list into 13 potential stocks to watch for options trades!

I’ll ALSO cover how to survive market corrections, the journey to a million dollars, the 3 skill sets to build wealth, and more. Continue reading "Sneak Peek: Bear Market '22"

Chart Spotlight: Target Corp. (TGT)

With millions of kids heading back to school in just weeks, investors may want to keep an eye on oversold retailers like Target Corp. (TGT).

TGT Chart Analysis

Source: MarketClub

Granted, Target hasn’t been popular among investors.

After all, the stock collapsed on an earnings miss. EPS came at $2.19, which was short of expectations. Revenue came at $25.17 billion. Analysts were expecting sales to come in at around $24.49 billion.

“Throughout the quarter, we faced unexpectedly high costs, driven by several factors, resulting in profitability that came in well below our expectations, and where we expect to operate over time,” Target Chief Executive Brian Cornell added.

It’s why the TGT stock plummeted from about $207 to a low of $140.

But the pullback has become overkill, creating a solid opportunity.

TGT Chart With Trade Triangles

Source: MarketClub

For one, according to the MarketClub tools, the intermediate and short-term trends are moving in the right direction. MarketClub is showing green weekly and daily Trade Triangles, which is an indication of further short term upside in the beaten-down retail stock. Continue reading "Chart Spotlight: Target Corp. (TGT)"

Chart Spotlight: Tellurian Inc. (TELL)

Natural gas prices are exploding.

For one, Russia said it would cut natural gas shipments to Europe.

In fact, as noted by Barron’s, “Russian company Gazprom said on Monday that it will cut natural gas shipments from the key Nord Stream pipeline to Germany starting this week. The pipeline’s exports will be cut to 20% of capacity, down from 40%, because of a sanctions-related issue with turbines serving the pipeline.”

Two, there are drought conditions in the U.S., and a heat wave forcing millions to turn up their air conditioners to full blast.

Three, according to EQT CEO Toby Rice, as quoted by Barron’s, “In the United States, we’ve got the natural gas here, we’ll be fine. But you think about our allies in Europe, and the tremendous power and influence that Russia has on these countries. Clearly, we need to take away the gun, and provide the energy to our allies around the world.”

All could create a big opportunity for natural gas stocks, like Tellurian (TELL).

Tellurian – a $2.1 billion company – is “building a low-cost, global natural gas business, profitably delivering natural gas to customers worldwide.”

Better, the company could benefit from a substantial shortage of natural gas.

In fact, according to its latest investor deck, geopolitics and energy security providing a step change in global LNG demand. Tellurian notes there’s (1) underinvestment in energy and post-CV structural growth have collided with a geopolitical crisis; (2) A need to replace 20 Bcf/d of Russian gas to Europe, equivalent to ~35% of the world’s LNG market; (3) Natural gas shortage expected to lead to catastrophic consequences.

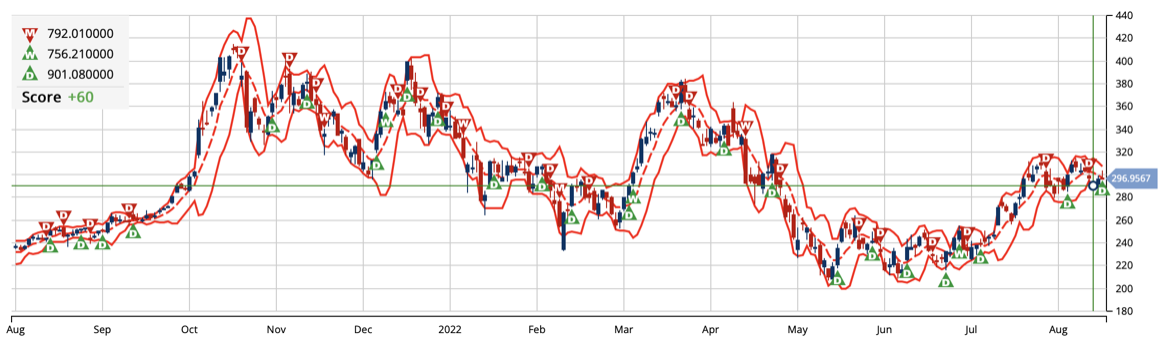
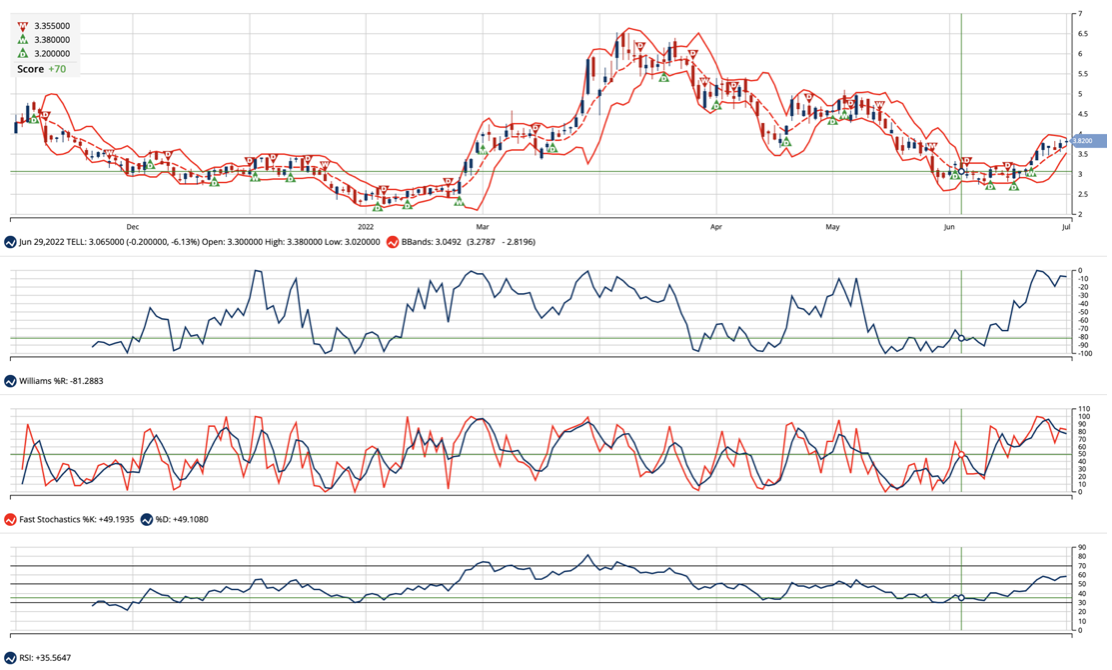
Technically, according to MarketClub, shares of TELL are slightly overbought. The MarketClub Smart Scan also gives the stock a score of +60, which tells us at the moment, the stock is struggling to move in a solid trend.

However, with natural gas prices showing no signs of cooling off, I’d like to see the stock run from a current price of $3.68 to $5, near-term.

The MarketClub Trade Triangles are also mostly green.

While it’s telling us that the longer-term trend has been down over the last month, the intermediate trend has been strong since mid-July. In addition, the short-term trend, according to Market Club, has been up since mid-July as well.

TELL Chart with Trade Triangles

Source: MarketClub

Ian Cooper
INO.com Contributor

The above analysis of Tellurian Inc. (TELL) was provided by financial writer Ian Cooper. Ian Cooper is not a Registered Investment Advisor or Financial Planner. This writing is for informational purposes only. It does not constitute an offer to sell, a solicitation to buy, or a recommendation regarding any securities transaction. The information contained in this writing should not be construed as financial or investment advice on any subject matter. Ian Cooper expressly disclaims all liability in respect to actions taken based on any or all of the information on this writing.