Gold Stock Correction And Upcoming Opportunity

Before updating the status of the gold miner (HUI) correction, let’s take a quick review of the Macrocosm because it’s always a good time to be clear on important macro considerations.

The graphic makes the following points that are the foundation of the NFTRH view on the right/wrong times to be fundamentally bullish on the gold-stock sector. In order of priority, a bullish view needs:

  • A contracting economy, which…
  • Drives counter-cyclical gold higher vs. stock markets (and many other assets), and…
  • By extension, sees a general decline in economic and market confidence.
  • When an economic boom phase ends, yield curves bottom and start to steepen.
  • Gold rises vs. commodities and materials, some of which represent mining costs.
  • Gold rises vs. all major currencies, which is also a sign of declining systemic confidence.
  • Inflation expectations can be constructive for gold and especially silver, which drives ‘inflationist’ bugs into gold stocks, but this is not fundamentally positive if the inflation is cyclical and drives commodities like energy and materials more than gold. This is when gold stocks rise against their proper fundamentals. *
  • Cyclical inflation, as in 2003-2008 can see the sector rise strongly (HUI was approximately +300% in that period) but the end will be bloody, as per the Q4 2008 sector cleanout.
  • China/India “love trade”: Hahaha… when you see this in writing, run away from it.

Continue reading "Gold Stock Correction And Upcoming Opportunity"

Gold Falls As Silver Misses Target

Both top metals couldn’t sustain the growth, although silver was more convincing than gold this time again.

Let’s start with the updated gold chart below.

gold
Chart courtesy of tradingview.com

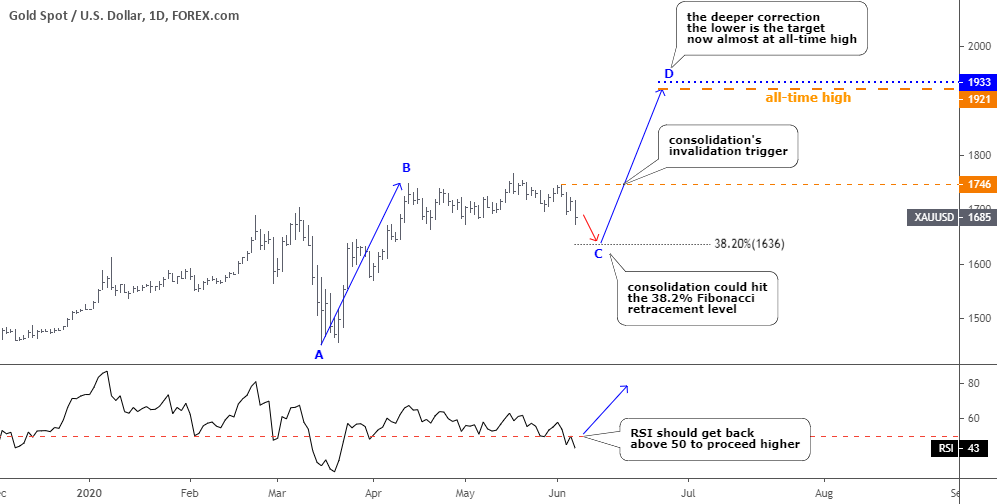
Gold is still consolidating as it couldn’t overcome not only the nearest peak of $1766 but it also failed right at the top of the AB segment of $1748. The RSI dipped into the bearish zone below the crucial 50 level. So, it’s the right time to put our classic instrument called Fibonacci retracement level as gold watches ground while both feet are in the air. The first important 38.2% Fibonacci retracement level could offer support at $1636. Continue reading "Gold Falls As Silver Misses Target"

Are Palladium, Gold And Silver Set To Takeoff?

In this post, I'll go over the charts for palladium, gold and silver, but first I would like to start with palladium futures as it has the most potential gain to reach this round. At the start of May, I shared with you the map with equal opportunities for this champion metal to either break up or down. Here is how you saw the future for palladium in the graph below.

Palladium Poll

The majority chose the “break down” option, although with a minor advantage, but this bet played out as the metal’s price dipped one more time in the third leg down of a large correction. You were right again!

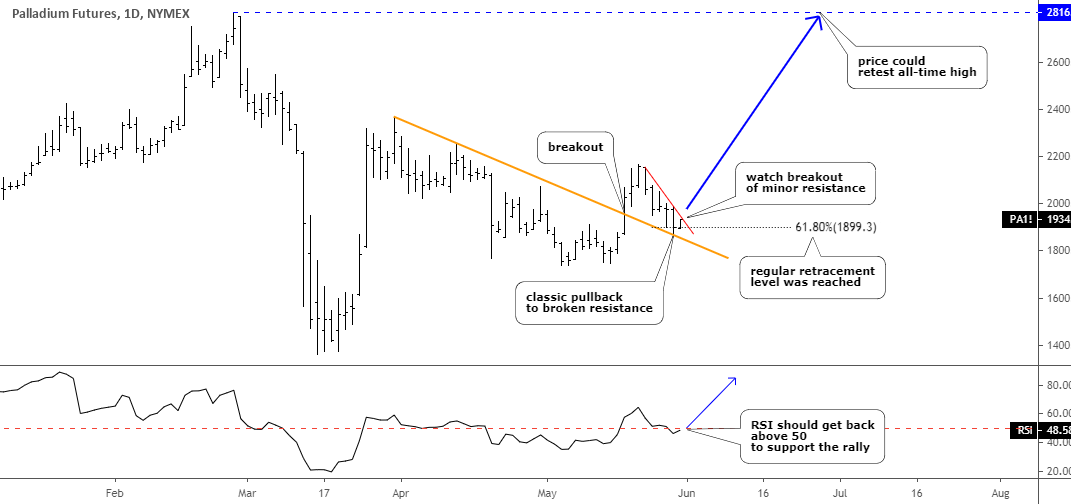
Now, let’s get down to the hot opportunity that I spotted for you on the palladium futures daily chart as it’s worth watching on the Gold & Silver Primetime.

Palladium Gold Silver
Chart courtesy of tradingview.com

The chart structure of palladium futures on the daily time frame could indeed be posted in the trading textbook as it is neat and smooth. I put detailed explanations here and on the chart as this metal gives such an excellent opportunity for education. Continue reading "Are Palladium, Gold And Silver Set To Takeoff?"

Silver Hits Charts As Gold Fails To Perform

In my earlier post this month, I shared hot trading opportunities for silver and gold. It’s time for an update as we’ve already seen how it played out.

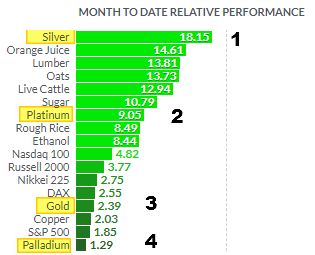
Before we start, I would like to show you the metals performance month-to-date in the graph below.

Futures Board
Chart source: finviz.com

This month silver showed the best performance gaining impressive an +18.15%. The second best wasn’t gold; it’s platinum with a +9.05% gain. Gold is in third place this month, with a +2.39% rise. The most precious of these four metals, palladium, could score only a +1.29% gain.

You were accurate again with your forecast as most of you bet on silver (see chart below) under my last post. Seers in action!

Silver Gold Poll

Let’s get down to the updated charts, and I will start with silver. Continue reading "Silver Hits Charts As Gold Fails To Perform"

Gold Eyes All-Time High As Silver Targets Former Top

I spotted hot trading opportunities for you on daily charts, so let’s skip straight to it. Gold will be the first.

Gold
Chart courtesy of tradingview.com

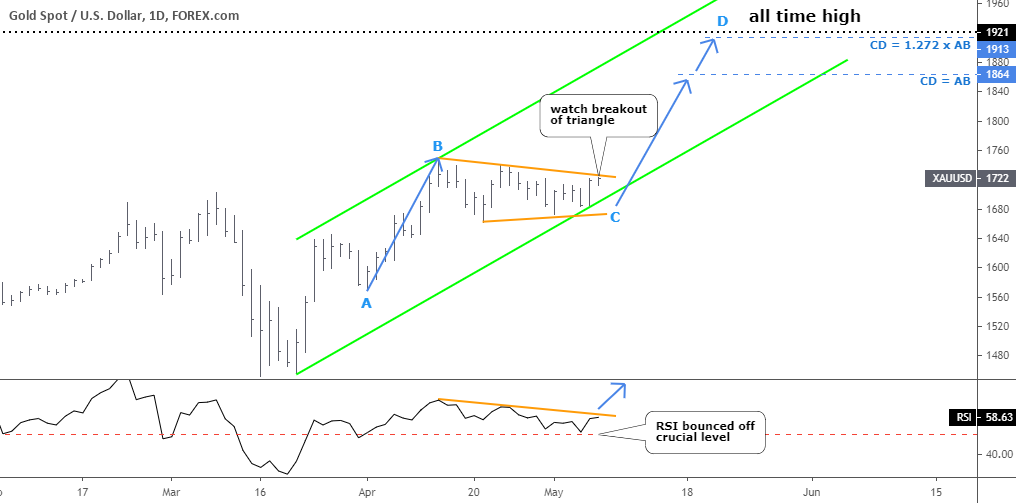
Gold got stuck in a sideways consolidation after it hit a new high of $1748 in the middle of April. The lower peaks and higher troughs shaped a very familiar pattern of a contracting triangle (orange trendlines). The price has reached the upper side of that pattern as I write this post. Watch the price to break up out of the triangle to confirm the move up. Continue reading "Gold Eyes All-Time High As Silver Targets Former Top"