Gold Bounced as Silver Broke Downtrend

Both triggers were pulled in the precious metals since my last post about gold and silver. I hope it is interesting for you to see how you voted about the metals price action in that article.

Let’s start with the gold votes below.

Gold Bounced

Most of you (54%) thought that gold would resume the drop. It was a slight edge over the other option where you chose the completion of the pullback. Let’s check in the chart below to see what actually happened with the gold price since then.

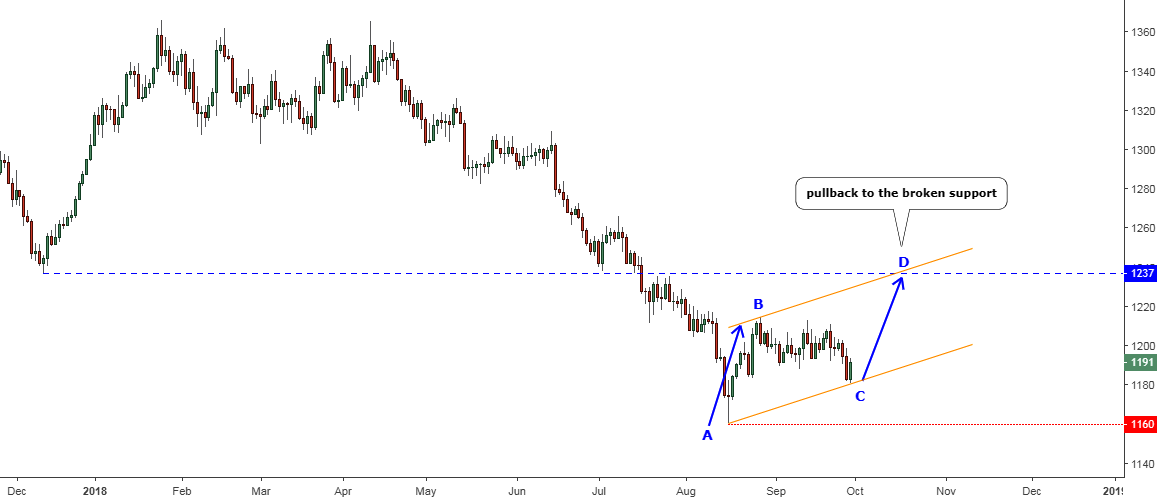
Chart 1. Gold Daily: Second Leg Of A Pullback
Gold Bounced
Chart courtesy of tradingview.com

The price of gold has finished the consolidation highlighted with the thin red down arrows in the earlier chart between the B and the C points of the blue AB/CD segments. The simple measurement pointed at the $1180 level, where I said the CD segment should start. Indeed, the gold has hit the $1181 low within the BC part and then bounced up towards the end of the last week to close at the $1191. This is the magic of simple math, which occurs in the charts again and again. Continue reading "Gold Bounced as Silver Broke Downtrend"

Gold Struggles While Silver Doesn't

In this post, I will take a deep dive into the chart structure of the precious metals as prices approach crucial triggers but on the opposite sides of each metal.

Let’s start with gold as it struggles to gain a foothold above $1200.

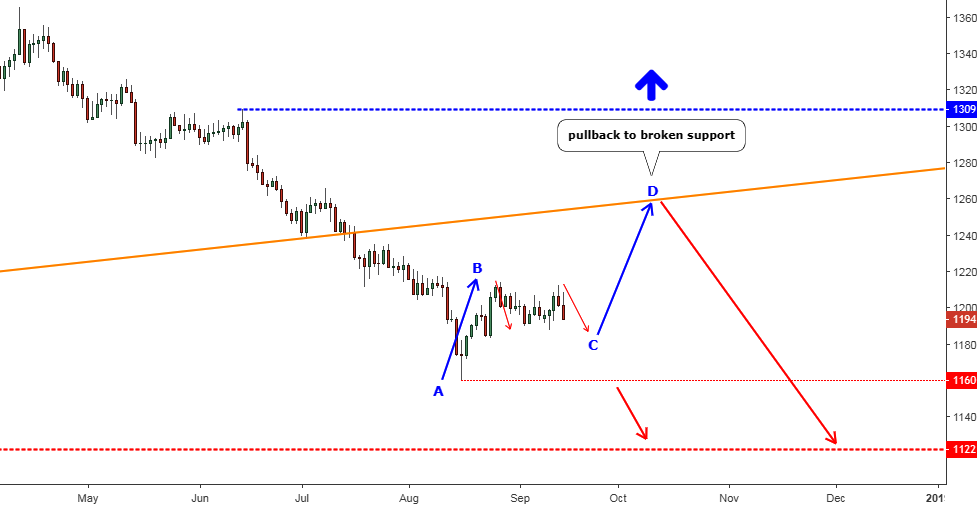
Chart 1. Gold Daily: Pullback

Gold Struggles
Chart courtesy of tradingview.com

The votes were split almost evenly in the poll in my earlier post about the gold’s outlook. Half of the readers chose the trigger of the upside resistance at the $1218 and the rest thought that the market would drop to retest the $1122. The metal price then was just a little bit lower than these days at the $1186.

Almost one month has passed since then, and to my surprise, none of the triggers were pulled although we were very close to the $1218 point, the market couldn’t push above the $1214 at the end of the August and then retreated below $1200. This month we could see the increasing activity as investors are back from their summer holidays. There was another attempt to clear the resistance last week, but it stalled at the $1213 and the significant level again remained untouched. Continue reading "Gold Struggles While Silver Doesn't"

Gold & Silver: Hard Ground or Quicksand?

I know that most of the readers don’t like when I post bearish outlooks for the top metals as even if there are dozens of downloads, still nobody pushes the “like” button. It could be a fascinating research subject for behavioral finance or at least an excellent contrarian indicator.

Frankly speaking, I keep an unbiased stance and share my view of the structures that develop in the market. I just read signals that the market sends us all the time. From the start of the year, there are totally bearish outlooks were posted as we had strong signs in the charts and we can see that they proved to be right and one could make good money.

In this post I would like to address the question that arises these days, is this recent bounce a reversal or just another correction?

Let’s start with gold.

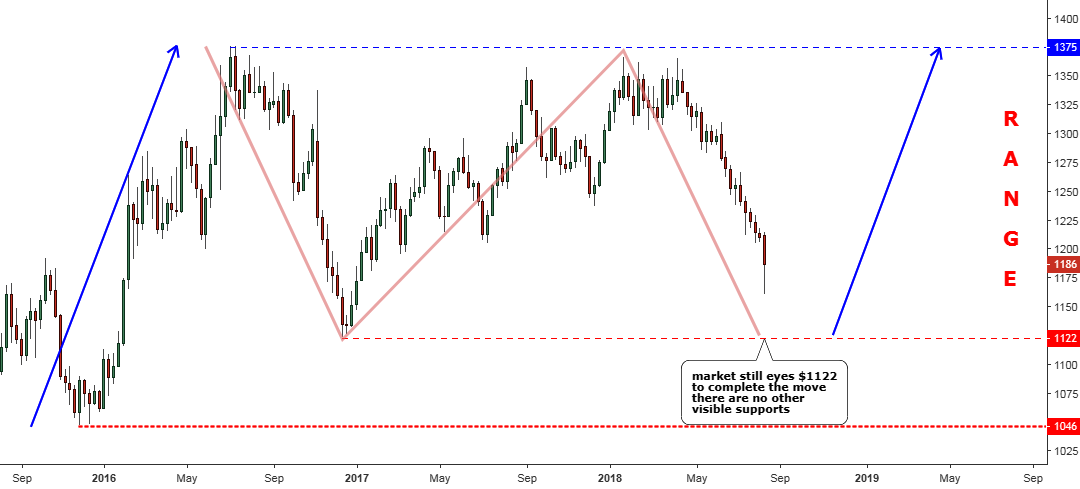
Gold Weekly Chart: Market Eyes $1122 To Complete The Structure

Gold Weekly Chart
Chart courtesy of tradingview.com

Before we start I recommend that you check out this earlier gold chart to see the price and triggers’ position before the drop and signals, which I outlined in that post to refresh your memory as more than six months passed. Continue reading "Gold & Silver: Hard Ground or Quicksand?"

Gold Update: Old Is "Gold"?

Aibek Burabayev - INO.com Contributor - Metals - Gold Update


Recently, I was looking for my school notes amongst my old stuff for my eldest daughter to help her understand chemistry as my school teacher was a real fanatic on this subject. During the process, I found many things with memories from my youth, and it prompted me to call my old friends and discuss those handwritten letters that we used to send by messenger. We couldn’t have ever imagined that the digital era would come.

Quite often things from the past can help us today. I decided to dig deep into the past on the gold chart to understand what is happening with our frozen gold market these days. Bingo! He who seeks shall find.

Below is the chart with my annotations to illustrate the findings.

Chart. Gold Quarterly (Logarithmic): This “Vinyl” Could Play Again

Gold Update
Chart courtesy of stooq.com

First of all, I would like you to pay attention to the word “Logarithmic” in the chart title, which is usually abbreviated as “Log” in the chart options. It means that the Y-axis of the chart has log scale, which is nonlinear and commonly used for the broad range of the data. Continue reading "Gold Update: Old Is "Gold"?"

Gold Failed And Silver Is On The Edge

Aibek Burabayev - INO.com Contributor - Metals- gold silver prices


As promised in my earlier post I updated the silver chart for you in this post as I spotted some exciting patterns forming on the chart below. But first, I would like to start with the stronger of the two metals, gold.

Chart 1. Gold Daily: Couldn’t Tag Previous Top

gold silver prices
Chart courtesy of tradingview.com

Indeed, it was another excellent try when the bulls attempted to break loose from this long-lasting range established between $1046 and $1375 in 2016. But the RSI indicator didn’t agree as lower tops showed a hidden Bearish Divergence and this spoiled this nice bullish attack. The $1375 resistance has been left untouched. Moreover, now this strong indicator indicates that the bears took the ball as it dipped below the crucial 50 level. Continue reading "Gold Failed And Silver Is On The Edge"