Cyclical Assets Vs. Gold

In January of 2018, we noted a cyclical leader (Semiconductor Fab Equipment) in trouble: Semi Canary Still Chirping, But He’s Gonna Croak in 2018.

We also ran a series of articles featuring the happy-go-lucky 3 Amigos (of the macro) in order to gauge a point when larger herds of investors would become aware of cyclical issues facing the global (including the US) economy. Each Amigo (SPX/Gold Ratio, Long-term Treasury yields, and a flattening Yield Curve) would ride with the good times but signal an end to those good times when reaching destination (Amigos 1 & 2 got home but #3, the Yield Curve is still out there). Here is the latest Amigos status update from October: SPX/Gold, 30yr Yields & Yield Curve.

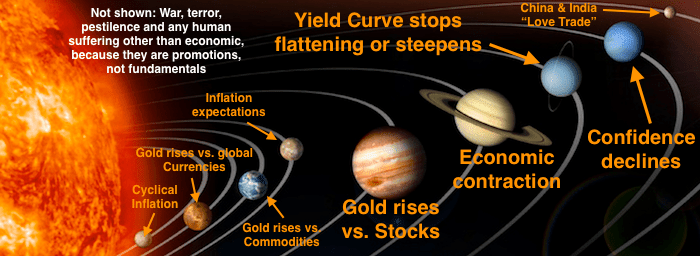
Today I would like to stick with a cyclical macro view, but do so through a lens filtered by the ultimate counter-cyclical asset, gold. As market participants, we are lost if we do not have road maps. That is why we (NFTRH) gauged Semi Equipment vs. Semi (and Tech), the unified messages of the macro Amigo indicators and many other breadth and cyclical indicators along the way to safely guide us to Q4 2018, which has been a challenge for many, but business as usual for those of us who were prepared.

But gold, which all too often gets tied up in an ‘inflation protection’ pitch by commodity bulls, is one of the best signalers of a counter-cyclical backdrop as its best characteristic is that of value retention and capital preservation. Gold, being outside the constellation of risk ‘on’ assets does not pay any income, does not leverage good economic times and does not inherently involve risk because it is a marker of stable value. Hence its underperformance during cyclical good times (leverage and all) and its outperformance during troubled counter-cyclical times.

So let’s take an updated look at gold vs. various cyclical items Continue reading "Cyclical Assets Vs. Gold"

Gold & Silver: US Dollar Could Spoil Santa Claus Rally

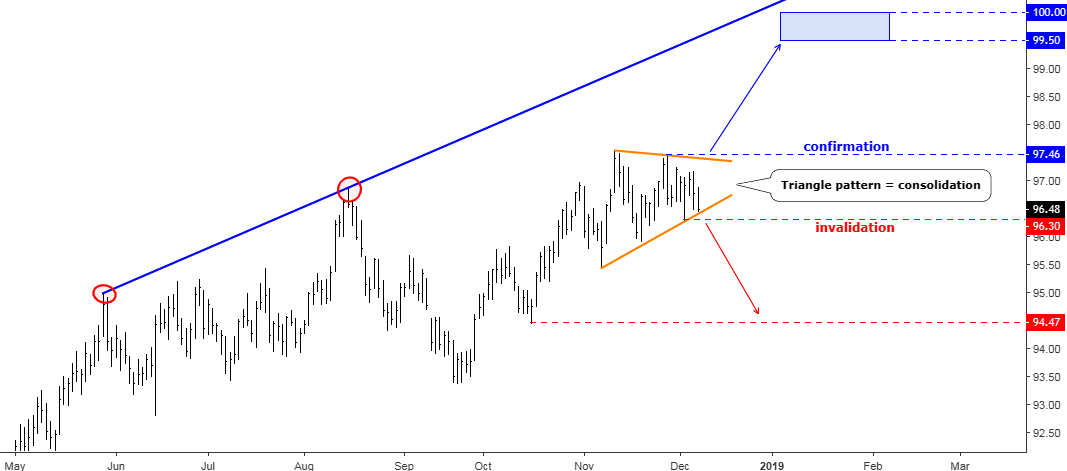
Here we are on the final track of the year, and investors hope for the traditional Santa Claus rally in the precious metals sector. This euphoria of the anticipated strength based on the current move up could be spoiled if this pattern would emerge in the US dollar index (DXY).

Chart 1. US Dollar Index Daily: Triangle

US Dollar
Chart courtesy of tradingview.com

The disappointing data of US non-farm payrolls released last Friday couldn’t damage the US dollar as it kept above the former trough established on the 4th of December at 96.30. The first reaction in the market was a USD sell-off against all major currencies, but it was short-lived, and none of the former extremes were breached. This made me focus on the Dollar Index chart to see if there is some pattern or trading setup has been shaping amid this unusual market behavior. Continue reading "Gold & Silver: US Dollar Could Spoil Santa Claus Rally"

Gold Stocks Acting As They Should

The macro has moved through a time of moderately rising inflationary concerns when economies were cycling up, many commodities were firm and risk was ‘on’. Contrary to the views of inflation-oriented gold bugs, that was not the time to buy gold stocks.

As I have belabored again and again, the right time is when the inflation view is on the outs, gold is rising vs. stock markets, the economy is in question, risks of a steepening yield curve take center stage (the flattening is so mature now that steepening will be a clear and present risk moving forward) and by extension of all of those conditions, confidence declines.

Well?…

gold stock sector

In short, the improving sector and macro fundamentals I’ve been writing about for a few months now continue to slam home as the cyclical world pivots counter-cyclical. And what do you know? Gold stocks are reacting as they should. Well, it’s about time, guys!

The technicals had already made some constructive moves as noted in an NFTRH subscriber update on December 4th. The update concluded as follows… Continue reading "Gold Stocks Acting As They Should"

Gold Extends Consolidation Giving Silver Another Chance

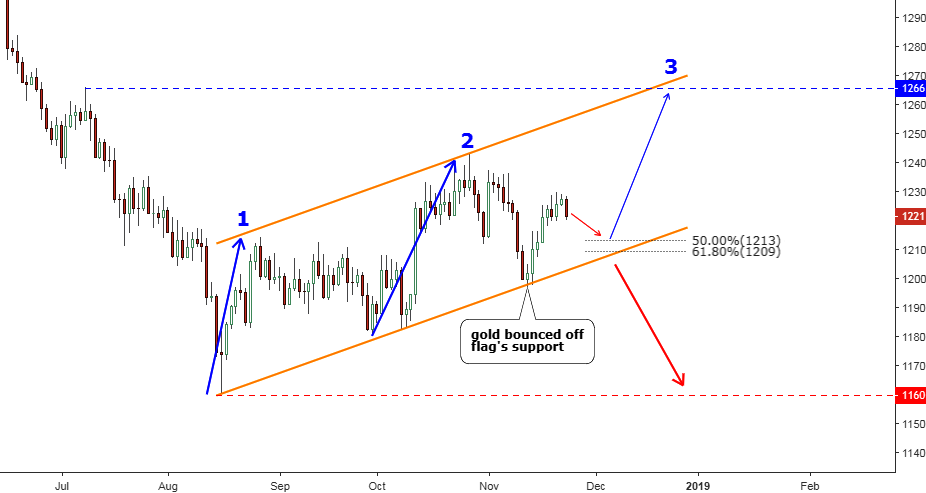
Gold and silver exchange leading roles in the market quite often, especially on the short-term charts. Last time I wrote about it silver saved gold from collapse at the start of this month. The white metal unexpectedly bounced off the earlier low reversing the drop of the yellow metal.

This time gold took the lead as its failure to break below the Bear Flag let silver lick its wounds and return above the $14 handle.

Both metals are still trapped in the middle of the range set by the earlier heavy drop, which first occurred in gold and then it was repeated in the silver market. In this post, I have focused on the local structure as the bigger picture remains unchanged.

Chart 1. Gold Daily: 3rd Leg Up Is Uncommon But Possible

consolidation
Chart courtesy of tradingview.com

The top metal couldn’t break below the trendline support of a Bear Flag (orange) and then quickly restored most of its losses coming back above $1200. It is interesting that the forecasted drop unfolded quite differently in each metal. Silver tagged the earlier trough, but gold failed even to breach the vertically sloped trendline. It looks like strong demand appeared right at the round number of the gold price in the $1200 area. Continue reading "Gold Extends Consolidation Giving Silver Another Chance"

Metals Moving In Unison For A Massive Price Advance: Part 1

Are the metals markets ending a price correction in unison and preparing for a massive price advance? This is the question we asked our research team to investigate and their findings may help skilled traders identify great opportunities in the future. This multi-part research article will share our most recent opinion about the metals markets as well as share some critical new data that can shed some light into what we believe will become a massive upside price rally in the metals markets. Let’s get into the data.

When one considers the global demand for Gold as a hedge against economic crisis events and the continued advancement in gold reserves for China and Russia, one has to consider the supply side issues that are a result of central banks global demand. Even though global production of Gold is near an all-time high, the demand from foreign nations and central banks are also near all-time highs. This correlation creates a demand-side consumption that offsets supply and, in some ways limits, consumer, retail and technology suppliers.

Our researchers focused on this aspect of the supply/demand equation when trying to analyze recent metals price action in correlation to disruptions that could occur in the markets. For example, increased central bank buying/hoarding of gold could dramatically result in prices spiking. Foreign market disruptions in supply could also send prices spiking. Global conflicts and or continued trade issues could send metals prices skyrocketing. Anything to do with the supply side for Gold could send prices higher. At least this is the conclusion of our research team at this time. Continue reading "Metals Moving In Unison For A Massive Price Advance: Part 1"