Could Santa Only Visit Gold?

We entered the most awaited period of the year when gold bugs could enjoy the traditional end of the year Santa Claus Rally. Let's check the charts to see if everything is setting up for a rally.

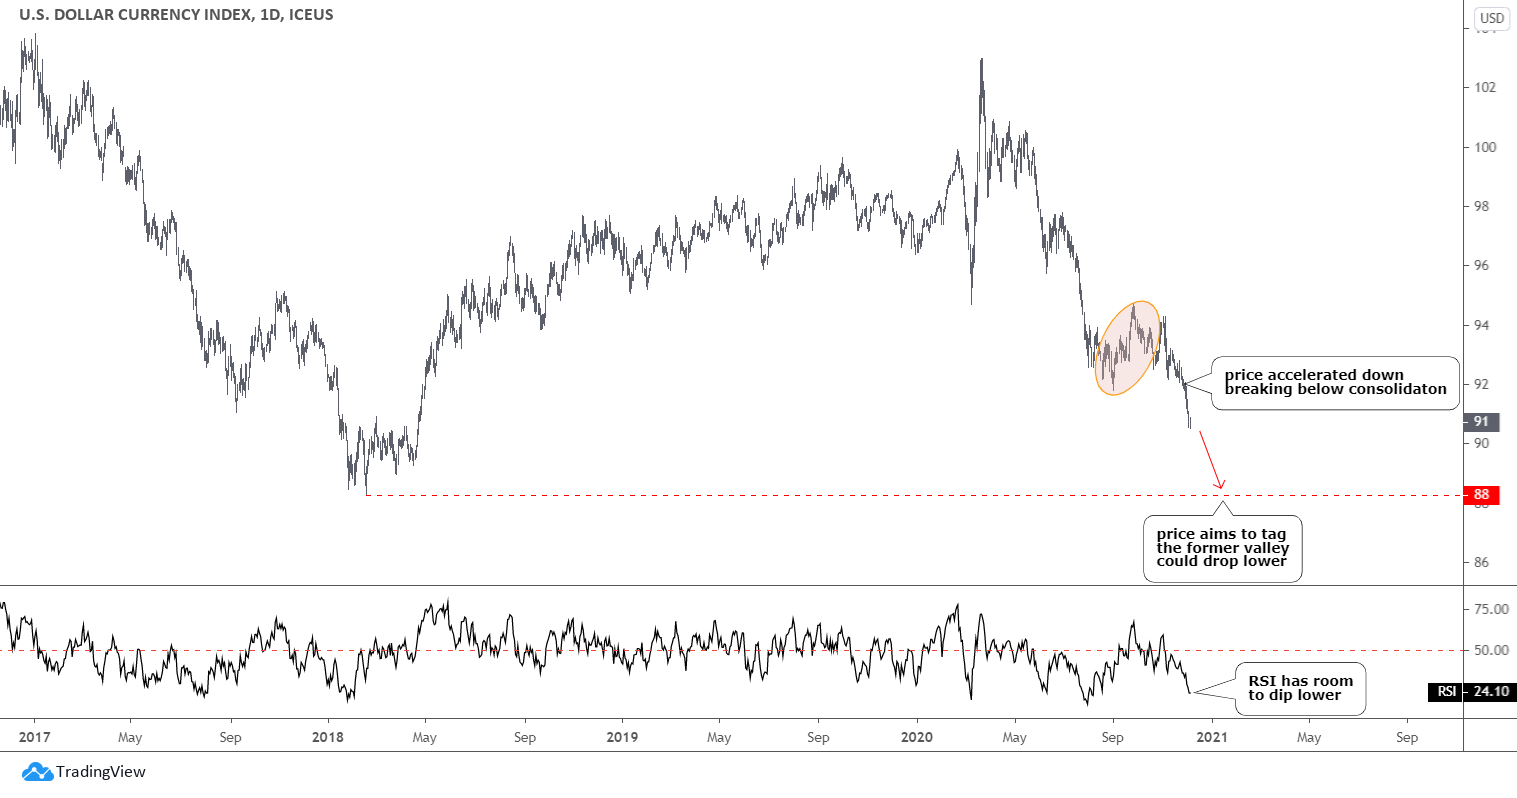
US Dollar Index Daily Chart

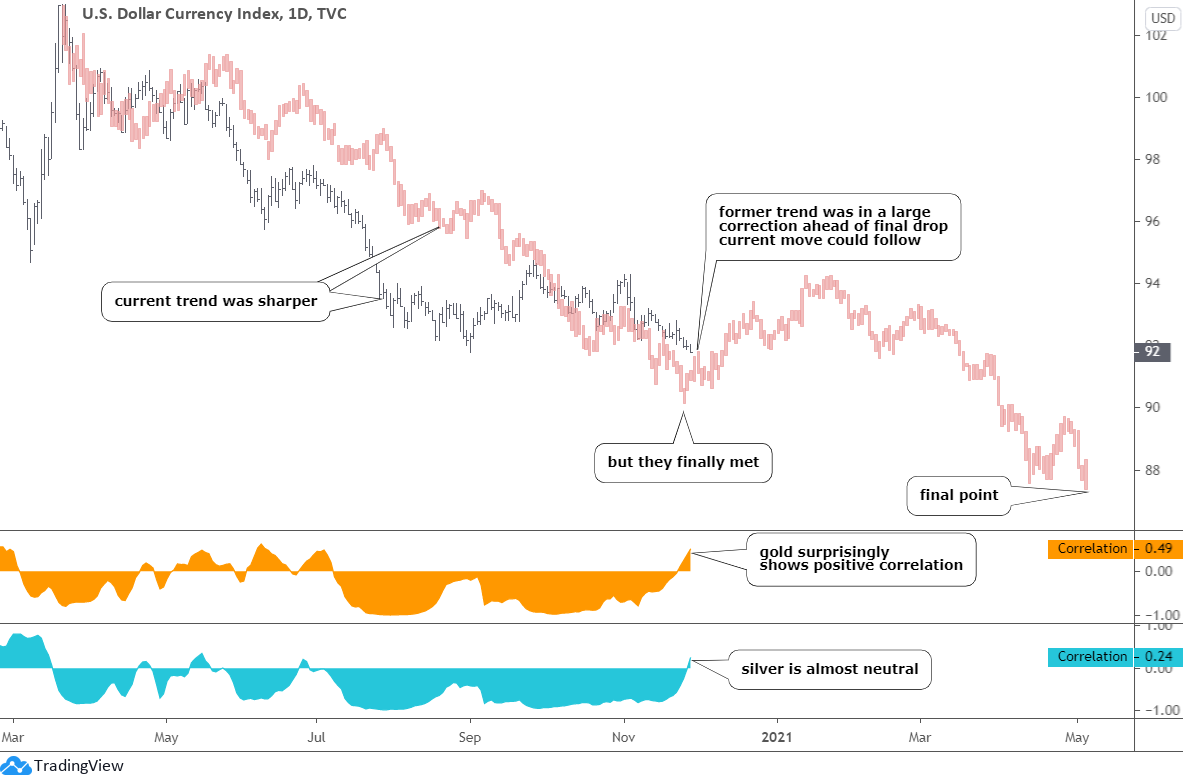
Most of you were right that the U.S. dollar index (DXY) will not follow the pink clone to the upside and continue down.

The DXY finally broke the valley of a consolidation. This gave the acceleration to the move down and buoyed the precious metals' prices significantly. Now, there are no other barriers ahead of the former valley area of 88. The DXY, aka "King," could dress up like a Santa, at least for gold. Please read till the end to see why I didn't mention silver. Continue reading "Could Santa Only Visit Gold?"

Gold Is Well-Behaved, But Silver Is Not

Sometimes we cannot rely on the correlation between certain instruments as they suddenly interrupt the link. I added the U.S. dollar index (DXY) chart below to illustrate it.

Silver Dollar Index

Surprisingly, gold's correlation (orange indicator sub-chart) went into a positive territory recently as it reached quite a decent number of 0.49 with an absolute correlation at 1.00.

Simultaneously, silver shows an almost neutral link, although it usually has a negative reading. All three of them dropped, but at a different speed. It indicates that the market has switched to the risk-on mode as safe havens were dumped. This time silver's dual nature showed up as it could shine when the world is a gloomy place, and when the world needs it as an industrial metal.

Now, let's look at Continue reading "Gold Is Well-Behaved, But Silver Is Not"

Gold & Silver: One More Move Down?

Old trading wisdom was the title for the previous post "Buy Rumors, Sell Facts" played out the same day it was published on the Blog. The price of gold dropped close to 6% from the top of $1966, and the pride of silver suffered even more as it fell more than 9% from the peak of $26.

The real reason behind that strong sell-off was the news that Pfizer's early data showed the COVID-19 vaccine is more than 90% effective, which brightened the outlook for the global economy and triggered the run from the safe-havens. Although my call in the previous post was based on the simple trading logic and the chart structure knowledge, it came true. Thank you for your support with helpful and prophetic votes and comments.

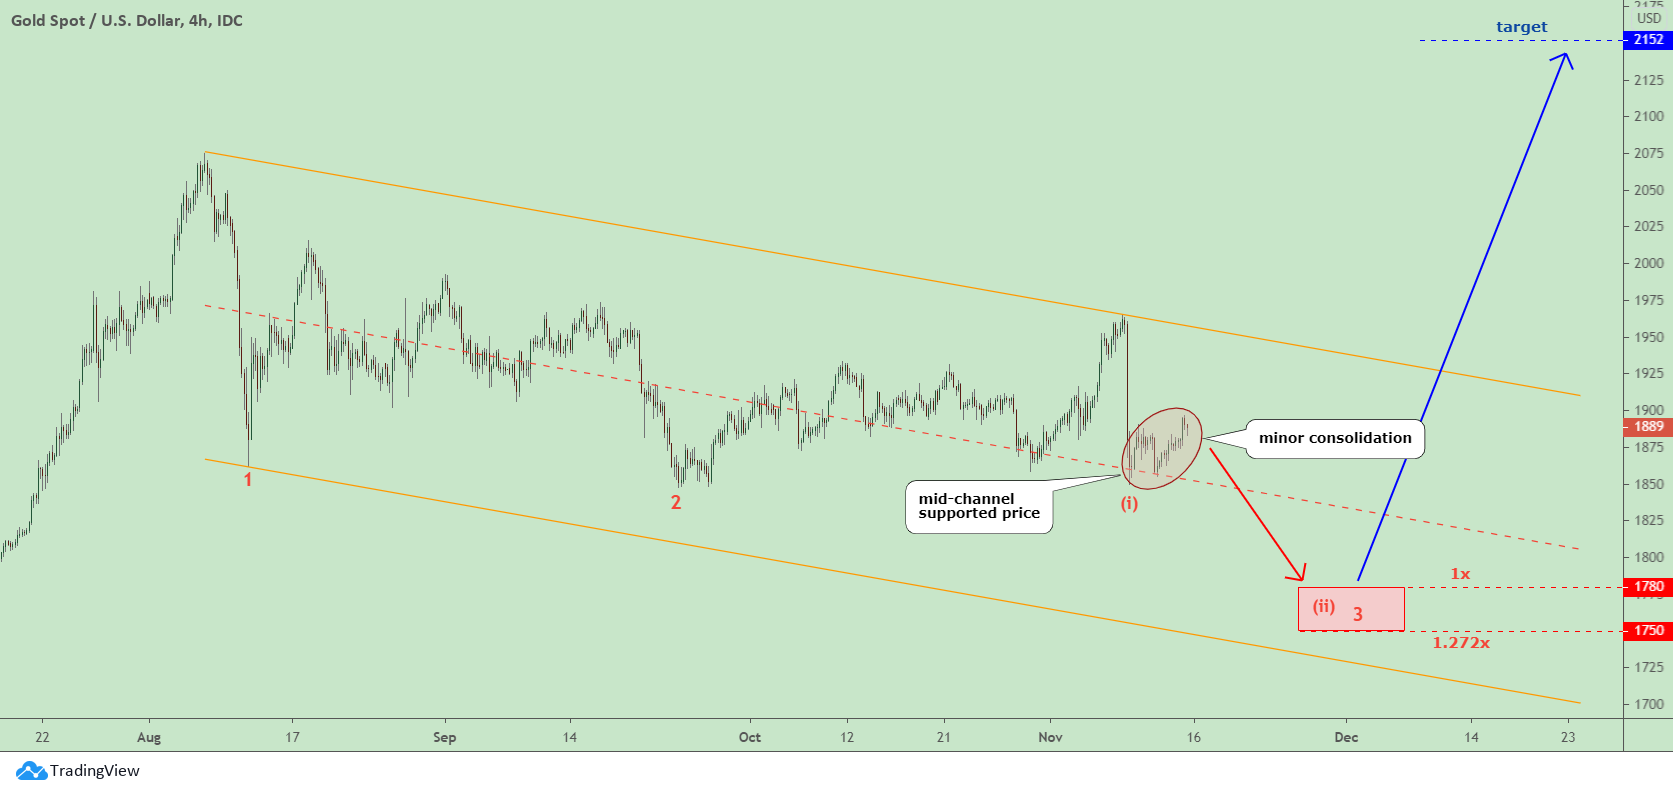
Let's get down to update; I switched to a lower time frame of 4-hour to highlight the current consolidation in more detail.

4 - Hour Gold Chart

This time gold shows a clearer structure than silver as the former broke below the counter-trend consolidation valley at $1859. This validated the current leg down then. Continue reading "Gold & Silver: One More Move Down?"

Gold & Silver: "Buy Rumors, Sell Facts"?

When there is something turbulent happening in the world, investors buy the dollar as a safe haven. However, when there is uncertainty in the United States itself, as we have been observing recently with the situation around the 2020 election, money shifts to a universal shelter to precious metals such as gold and silver.

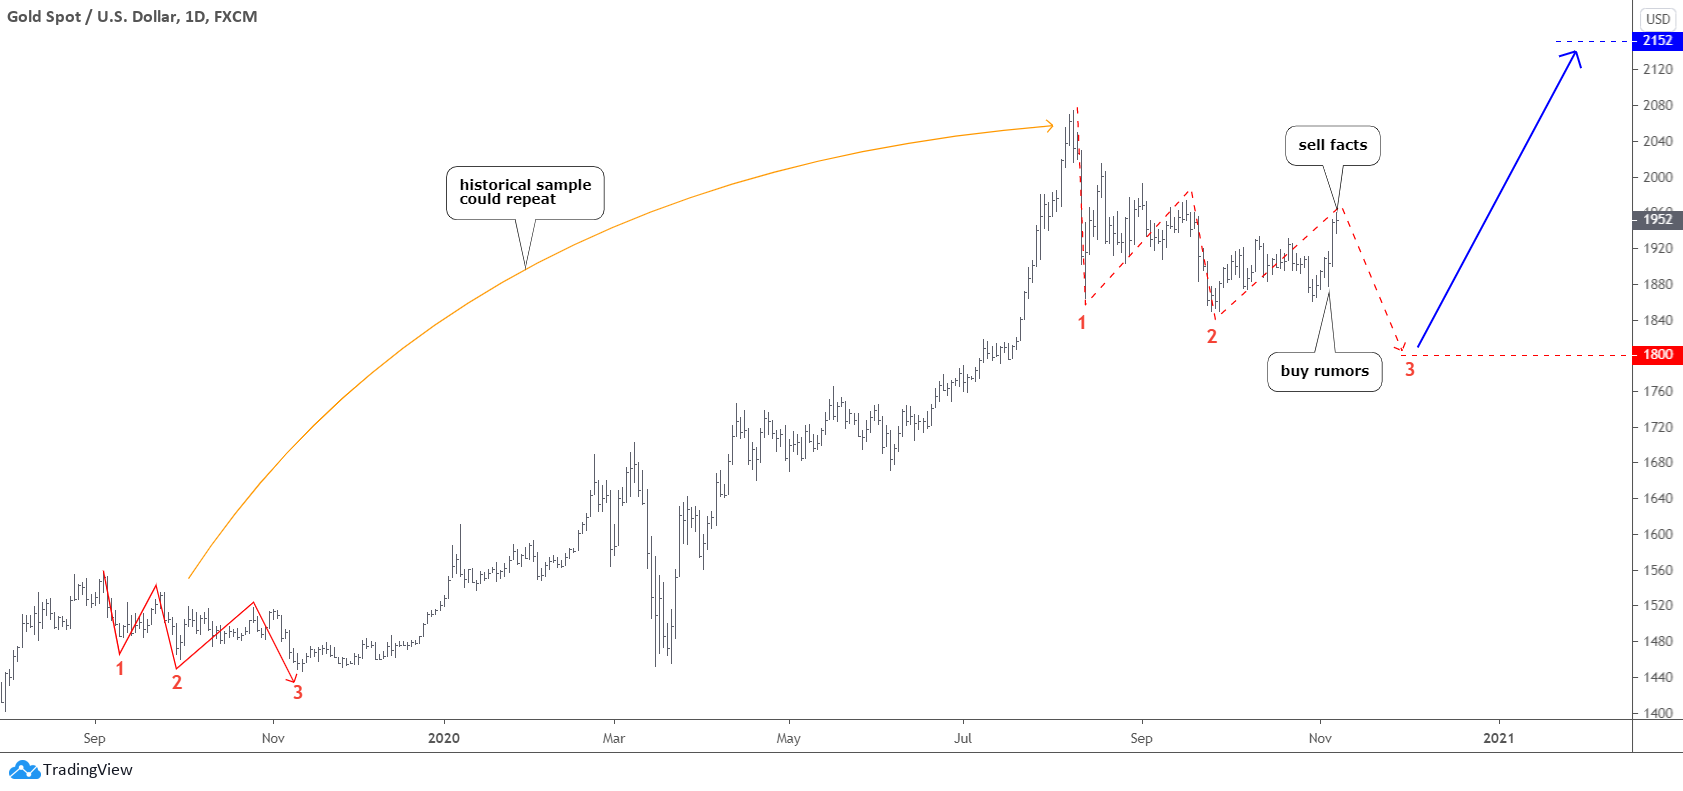
One should be careful these days, as we need to remember the old trading wisdom, which says buy rumors, sell facts. The Results of this election finally came out, catching traders out of access to the market on the weekend. This could be a good lesson to keep away during such a major event such as this US presidential election as volatility spikes dramatically as well as investors' emotions, and only a deep "pocket" could survive then.

Gold Chart

Gold was up and down with huge moves in both directions last week. It finished the period on the upbeat, as investors were puzzled with uncertainty over election results. The move-up was strong as the price quickly broke $1900 and gained $84 from $1876 to $1960 at the top. Some profit-taking then followed as the week ended lower at $1952. Continue reading "Gold & Silver: "Buy Rumors, Sell Facts"?"

The King Requires Respect

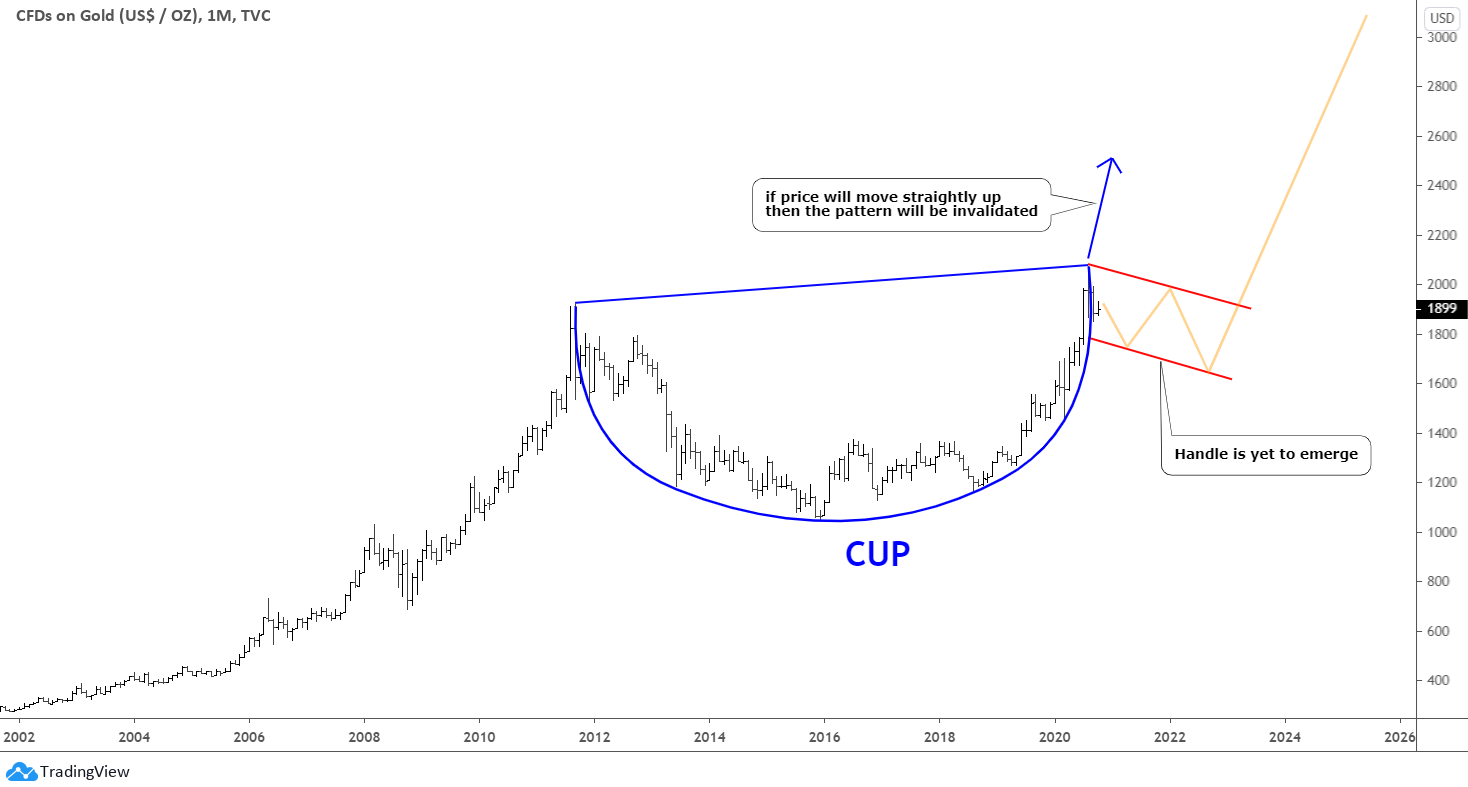
Before we get down to the update, I would like to answer the comment of our esteemed readers posted last week in more detail about the Cup & Handle pattern on the big gold chart. I think it will be interesting for all to see the visualization of my answer. Besides that, I prepared a bonus chart for you with an established pattern and a trade setup.

Let us start with that big gold chart first.

Gold cup handle pattern

The reader kindly provided exact coordinates, so I just built the pattern. As we can see in the chart above, it is safe to say that the shape of a Cup could have been completed already (blue). However, as I answered to that comment, we are missing the Handle part of the pattern yet. I put the possible shape of it in red on the chart. The price should make a zigzag inside of the Handle first; it could take several years as Cup has been shaped within long 9 years. Only then, the price could continue to the upside. The target will be located beyond $3000. To sum up, the pattern itself is possible, but it is not fully shaped yet, and we should wait to see how the market will play. Continue reading "The King Requires Respect"