Gold & Silver: The Dollar Still Looks North

The bouncing U.S. dollar index (DXY) makes the game these days for the top metals, so I added its chart below to show you the possible path of the next move.

U.S. Dollar Chart

Most of you agreed with the map that I showed you a month ago. It indicated more downside for the DXY. On the 6th of January, the dollar established a new valley at 89.21, proving we were right. The price followed the red zigzag down and even the turning point set around 89.5. Continue reading "Gold & Silver: The Dollar Still Looks North"

Custom Valuations Index Suggests Precious Metals Will Decline

My team prepares Custom Valuations Index charts to understand how capital is being deployed in the global markets alongside US Dollar and Treasury Yields. The purpose of the Custom Index charts in this article is to provide better insight into and understanding of underlying capital movements in various market conditions. Recently, we discovered the Custom Index chart shares a keen alignment with Gold (and likely the general precious metals sector). Let’s explore our recent analysis to help readers understand what to expect next in precious metals.

Weekly Custom Valuations Index Chart

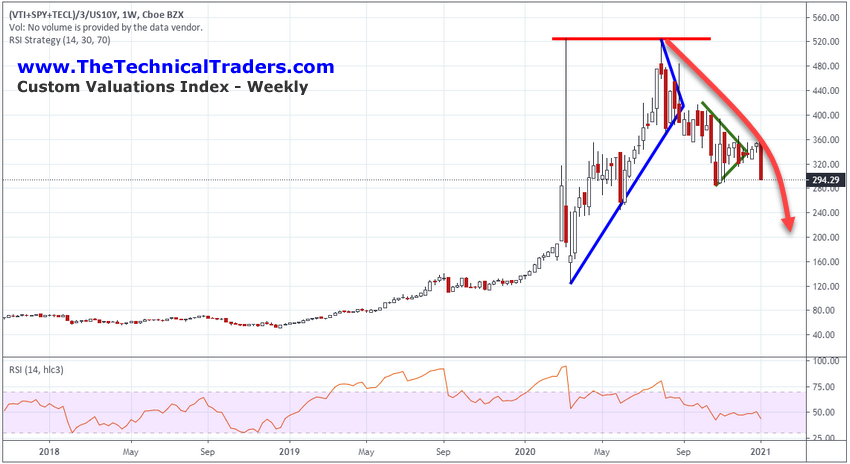
The first thing that caught my attention was the very clear decline in the weekly Custom Valuations Index recently, as can be seen in the chart below. The second peak on the Custom Valuations Index chart occurred on the week of August 3, 2020. Gold also peaked at this very same time. This alignment started an exploratory analysis of the Custom Valuations Index and the potential alignment with the precious metals sector.
Custom Valuations Index

The peak in the Custom Valuations Index on March 20, 2020 (near the height of the COVID-19 market collapse) presented a very clear upside target which was confirmed with a second peak level in August 2020. The fact that the Custom Valuations Index reached that peak level again and that peak level also aligned with the peak price in Gold may just be a coincidence. As we continue to explore this unique alignment, we’ll explore more unique characteristics to see if there is a link that is more than mere chance. Continue reading "Custom Valuations Index Suggests Precious Metals Will Decline"

Yield Curve Relentlessly Steepens

Another week, another yield curve steepener and continuation of the trend that began in August 2019.

yield curveyield curve

Flipping to the bigger picture I added in SPX, Gold, and the CRB commodity index for reference. With the levels of MMT TMM (total market manipulation) injected in the markets since Ben Bernanke cooked up the diabolical macro manipulation known as Operation Twist, I can’t pretend to quant the past to the present… Continue reading "Yield Curve Relentlessly Steepens"

A Poisoned Silver Arrow

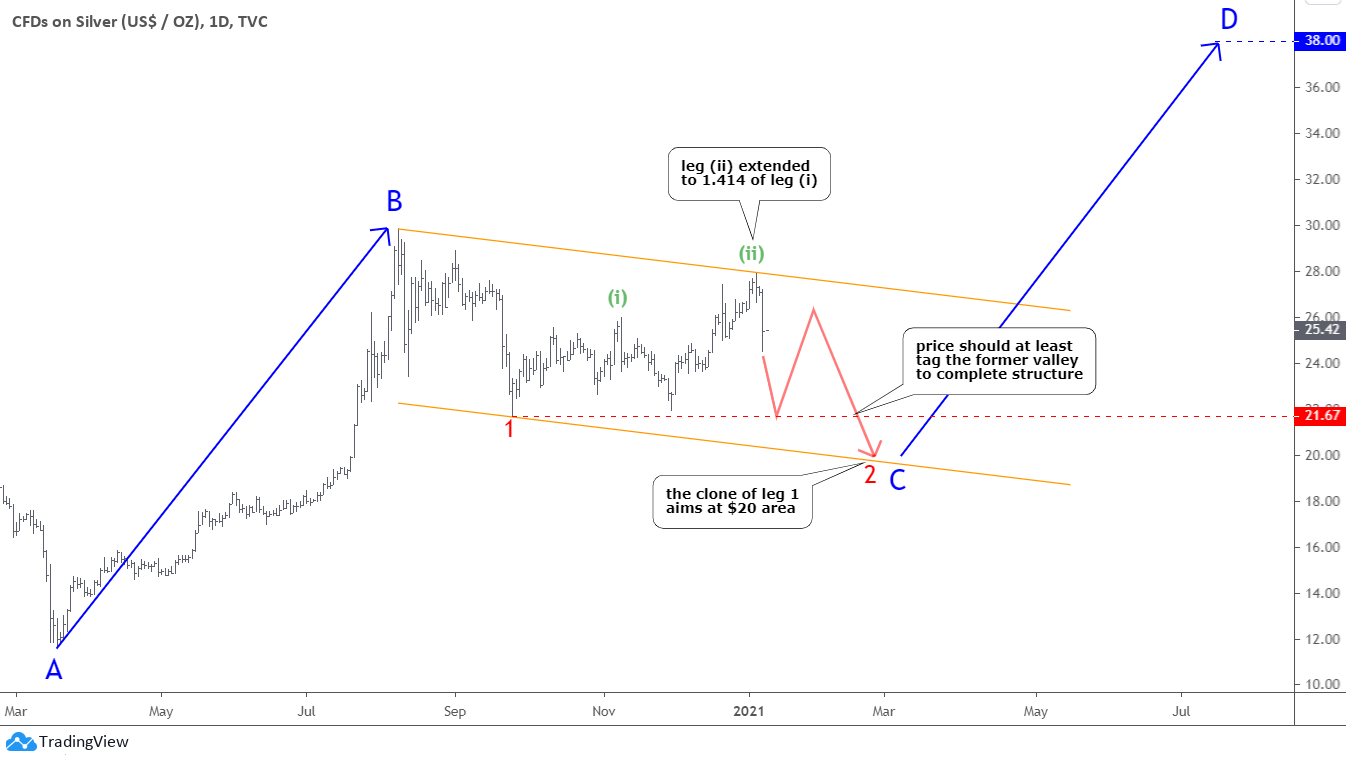
There is a quote from my post in November of 2020 - "Silver could spoil this party where the stars aligned for DXY and gold." I've meant that the uncompleted chart structure in the silver graph could signal a more complex correction despite the bullish move as it was just the junction between larger downside moves. These words turned prophetic as a poisoned silver arrow hit precious metals badly last week.

Hold on tight; the roller-coaster ride carries on.

Let us start with the silver chart below, and you will see why I chose it to be the first.

Silver Daily Chart

You saw this chart a month ago when I was questioning "Could Santa Only Visit Gold?" as I doubted the non-stop rocket move for silver.

It is the exact same chart with an updated price graph. The green leg (ii) of the joint moved exactly as projected in December. It just traveled a longer distance equal to 1.414 of the green leg (i). That is why I turned the orange trend channel higher. Continue reading "A Poisoned Silver Arrow"

Buy Setup For Gold, Two Paths For Silver

The plan posted at the end of November works amazingly well, so far as price accurately charts the preset pattern at least for the gold, which could offer a good trading opportunity soon.

Let us check the "King's" chart first to see what's happening.

Dollar Index

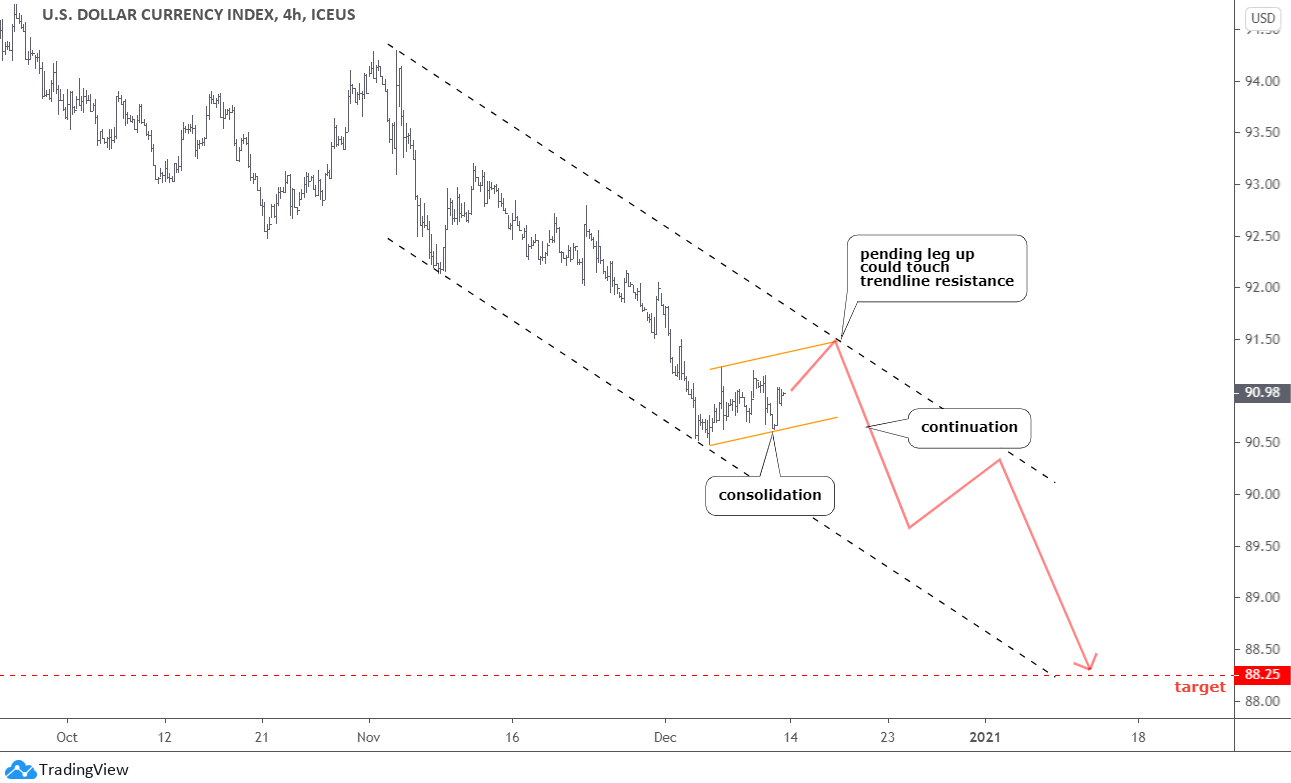
I switched to a smaller time frame to focus on the current leg down, as we saw on the chart before.

The U.S. dollar index (DXY) is building a slightly up-sloping sideways consolidation (orange channel). I think we can see another leg up to touch both the upside of the orange channel and the trendline resistance of the black dashed downtrend. This area around 91.5 would offer double resistance. Continue reading "Buy Setup For Gold, Two Paths For Silver"