Bitcoin, Dollar, Gold And Silver Update

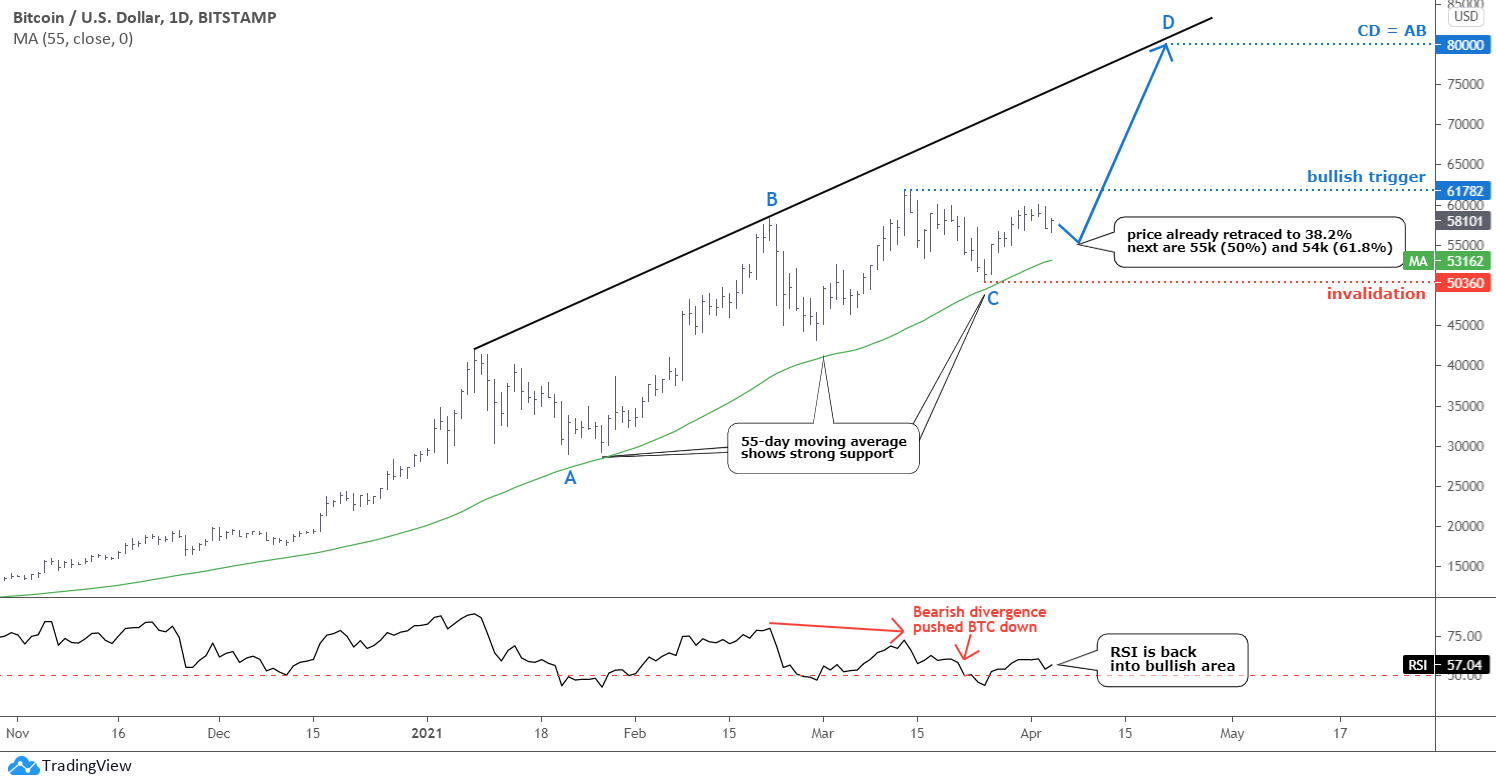
As Bitcoin matures, the chart structure becomes more readable over time. We can see how such a conventional indicator as a moving average perfectly supports the price. I added a 55-day (Fibonacci number) moving average (green), which at least three times this year kept the price in the bullish mode that started last October when the price crossed this line to the upside.

Another popular indicator RSI has perfectly detected the Bearish Divergence and pushed the price down last month. After that, it moved back above the crucial 50 level, which supported the current upward move.

Daily Bitcoin Chart

I see possible AB/CD segments in the chart (blue labels). The BC consolidation was huge and complicated, but it could be over now. If the CD segment travels the same distance as the AB part, then the price of Bitcoin could hit the new all-time high of $80,000. The projection of the black trendline resistance confirms that ambitious target, and we know how powerful the trends are. Continue reading "Bitcoin, Dollar, Gold And Silver Update"

Gold: What A Long And Not So Strange Trip

The Gold Miner correction was well earned, but it was not a bubble.

Even today there is some pablum out there talking about how if inflation is good for gold it is especially good for gold miners. I will simply repeat once again that if gold usually does not benefit fundamentally by cyclical inflation (i.e. inflation promoted for and currently working toward economic goals) the gold miners never do, unless they rise against their preferred fundamentals as they did during two separate phases in the last bull market, which were justly resolved with crashes.

Here are a couple charts we used in NFTRH 648 in a segment written to set the record straight. We have also used these charts – especially the first one – since the caution flags went up last summer, visually by the first chart and anecdotally by the usual suspects aggressively pumping the unwitting masses. Buffett buys a gold stock!… okay, well so much for that. Sentiment became off the charts over-bullish and now, as we prepare for the final act of the correction, it’s the opposite. That’s perfect.

HUI had far exceeded the Gold/SPX ratio and so it was very vulnerable from a macro fundamental perspective. Why on earth would players want to focus on miners digging a rock out of the ground that was starting to fail in a price ratio to the stock market? They wouldn’t, and since last summer they didn’t.

Gold

But from a sector fundamental perspective the Gold/Oil ratio (Oil/Energy is a primary driver of mining costs) and HUI show that the 2020 rally was nothing like the two bubbles of yesteryear, when not only did HUI hit danger signals (!) noted above by a macro fundamental indicator, it also made two separate bubbles vs. this sector fundamental. This time? Nope, no bubble here. Continue reading "Gold: What A Long And Not So Strange Trip"

Gold & Silver: Dollar Is Going Down

U.S. dollar index (DXY) 4-hour chart

Dollar Index

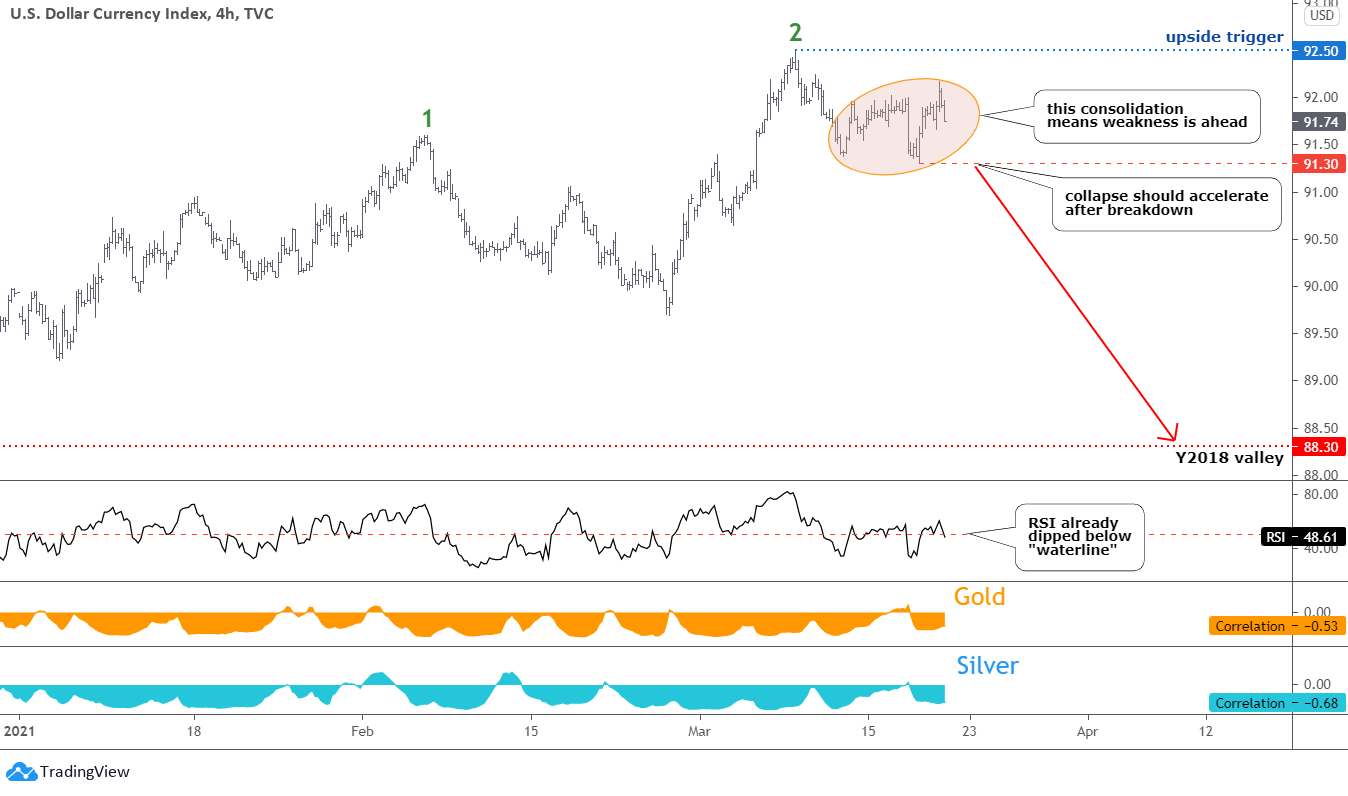
Last time the chart structure of the dollar was less clear; hence I put two opposite scenarios in the chart with triggers.

As time goes by, the market reveals itself more clearly. The DXY price built a familiar two-leg consolidation highlighted with the orange ellipse. It follows the preceding move down from the recent peak of green leg 2. It means further weakness is ahead. I put the trigger on the 91.30 mark (bottom of the minor consolidation) for confirmation. The target remains intact in the area of the Y2018 valley. Continue reading "Gold & Silver: Dollar Is Going Down"

Same Plan For Silver, Wake-Up Call For Gold

The U.S. dollar index (DXY) chart opens this update.

US Dollar Index

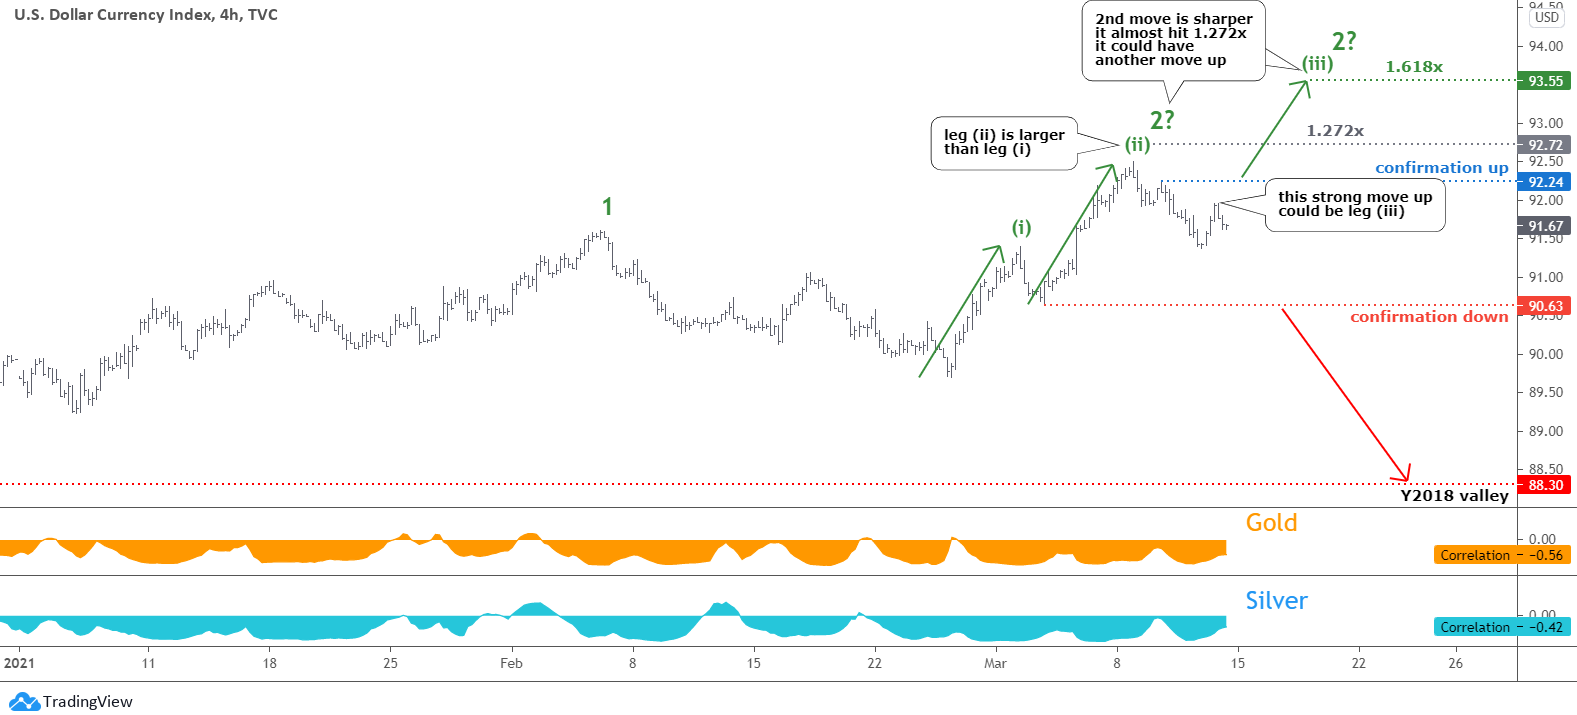
The plan posted at the beginning of this month played out amazingly accurate in the DXY chart. The dollar, indeed, moved to the upside hitting beyond the first target of 92.07, and it almost reached the second goal with a 1.272x multiplier at 92.72 mark. The maximum of 92.50 was established on March 8. This move has a sharper angle, and it reached the target earlier than the clone of the first move up.

This time I put more annotations to highlight all crucial things for education. The main question is whether the second move-up is over or not. We can see two distinct minor legs in the current move to the upside marked as (i) and (ii); the latter is larger than the former. Then the price reversed to the downside within a zigzag. This could be another minor consolidation ahead of the leg (iii) to the upside. Continue reading "Same Plan For Silver, Wake-Up Call For Gold"

Predictive Modeling Suggests A New Gold Rally

One of our readers’ favorite tools is the Adaptive Dynamic Learning (ADL) predictive modeling system. This tool maps out technical and price patterns into an array of similar setups using historical data, then applies that data to current and future price bars. Using the ADL predictive modeling tool, we can see into the future based on historical technical analysis that maps statistically relevant price activity and shows us the highest probability outcomes.

Monthly ADL Gold Predictions

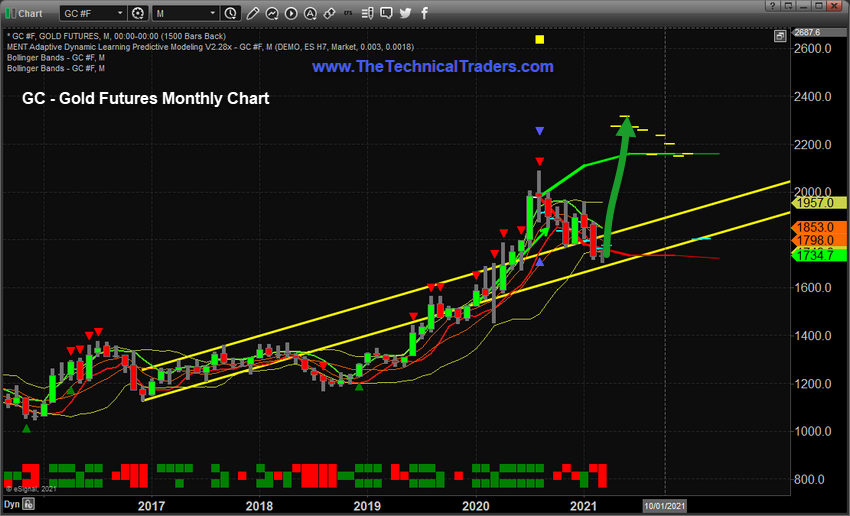
In this research article, we’re going to focus on Gold and how current price action suggests a bottom is likely near the $1720 level. The YELLOW price channels on this Monthly Gold chart highlight exactly where we believe support is located for Gold. If this $1700 price level is breached to the downside, then the previous lows, near $1400, are the next support level for Gold.

Our ADL predictive modeling system suggests the $1720 support level will hold, prompting a new rally to levels above $2200 within 30 to 60+ days. The ADL system predicts an aggressive move in Gold near May or June 2021. The move higher may happen earlier than the ADL Monthly predictions indicate. There is a chance that a move back above $1850 starts the move higher before the end of March or April 2021 – propelling Gold toward the $2300+ peak. The actual peak level predicted by the ADL predictive modeling system is $2315.

predictive modeling

2-Week ADL Predicts Gold May Start To Rally Near Mid-March

This 2-Week Gold Chart highlights a similar ADL price prediction. What we find interesting about this ADL predictive modeling outcome is the similar price predictions originating from vastly different origination points. The Monthly ADL prediction originates from a date of August 1, 2020 – the peak price bar. This 2-Week ADL prediction originates from a date of November 23, 2020 – the intermediate low DOJI bar before the recent continue downward trend targeting the YELLOW price channel. Continue reading "Predictive Modeling Suggests A New Gold Rally"