Gold Builds Buy Setup, Is Bitcoin Next?

Gold follows the map posted in an earlier update.

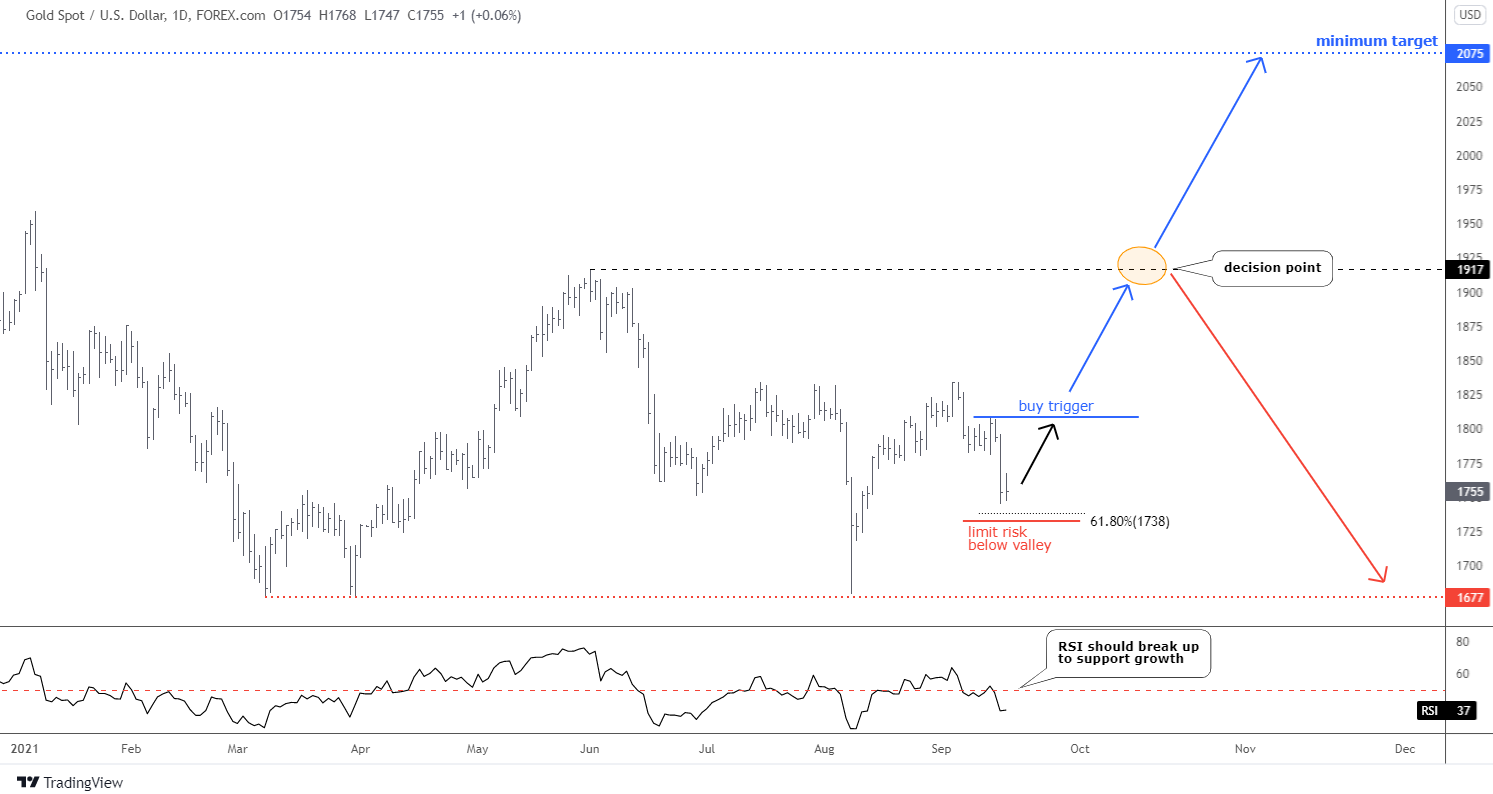
Daily Gold Chart

Gold dropped within two visible legs close to the area of 61.8% Fibonacci retracement level located at $1,738. The second leg down has overshot the size of the first leg reaching almost 1.272 of its distance. The RSI has shown two legs down either. Initially, the 50 level in the indicator’s sub-chart acted as a support, and then it turned resistance for the joint between two legs. Continue reading "Gold Builds Buy Setup, Is Bitcoin Next?"

Bitcoin and Gold Update: What's Next?

Bitcoin triggered the new buy setup posted last week.

Most readers confirmed that they see the new bullish opportunity in Bitcoin, and the largest part were ready to add or enter the new trade.

Bitcoin Daily Chart

The new buy setup repeated the first trade setup as the setback was not deep again as it only reached the same 38.2% Fibonacci retracement level.

The Friday brought the expected trigger above the previous Saturday’s top of $48,150. The setup is active now and should limit risk below the valley of correction to around $43,900. The risk/reward is good at 1:4, with the same target at the all-time high of $64,899. Continue reading "Bitcoin and Gold Update: What's Next?"

HUI Technical Status And Gold Stock Fundamentals

A review of the situation in gold stocks. It is, in essence, a year ago that Warren Buffett ill-timed his entry into the gold stock sector, unwittingly calling a top to the post-crash rally and signaling the start of the 2020 inflation trades, which did not include gold stocks (for logical reasons, as belabored in NFTRH and at NFTRH.com over the years). Increasing the view that ole’ Warren was playing contrary indicator last summer were the usual gold perma-bull suspects coming out immediately after with bullhorns a blaring as we noted in real-time on August 17, 2020: Buffett Buys a Gold Stock!

In the scope of the entire correction, as the bids rotated out of the precious metals and to a lesser degree growth/tech stocks into value stocks and cyclicals (including commodities) the inflation-instigated reflation trades hit stride, and gold stocks were sent on a long decline. Again, if you tune out the perma-touts and think rationally, the miners were only doing what they should do (see below).

There were two false breakdowns, the second of which sparked a strong rally. We also caught Mr. Buffett for a contrary signal to that rally on February 17, 2021: Buffett Pukes a Gold Stock!

The rally terminated at a key resistance level (as plotted well ahead of time as a caution zone in NFTRH) and here we are with HUI below its down-turning SMA 50 and SMA 200 (which needed to hold as support in order to maintain a constructive view), back in the downtrend channel (actually the Handle to a still bullish big picture, which is beyond the scope of this post) and the near-term bounce that I had been expecting has finally arrived after the rude interruption of an unexpected lower low.

That low came off of positive RSI and MACD divergences and here we are, on the bounce with the channel’s upper line, the down-sloping moving averages, and a clear lateral resistance area all taunting… “‘C’mon Huey, we dare you!” Continue reading "HUI Technical Status And Gold Stock Fundamentals"

Update: Gold Mining Fundamental Macrocosm

Gold miners require a unique macroeconomic backdrop.

When gold-stock bulls complain about a “smackdown,” a “hit,” or a “smash” against the poor gold-stock sector, what they should be thinking about is what a relatively small market the gold stock universe is compared to the multitude of galaxies populated by cyclical and risk on stocks and commodities and the massive bond market. The gold stock sector’s noise to trading volume ratio must be far and away the biggest bull market on the planet (I know because I am part of it :-)).

And once in a while, the sector actually warrants all that noise. Like in 2001 when markets were beginning a bear phase, and economies were faltering, like in Q4, 2008 when gold stocks were crashing to unwind previous inflationary excesses, leading stocks and commodities into a terrible crash and rebounding first. Like in March of 2020, when the miners crashed and ‘V’ bottomed to lead what is to this day an ongoing economic recovery born of inflation, gold and gold stocks first sniffed out.

And that is the rub. Personally, I have been favoring the prospect of a strong bull market (target: 500) after initially projecting an A-B-C upside correction target of 375 in 2019, which we put in the books at 373.85 last August. But in order to continue favoring an ongoing bull market scenario, the macro fundamentals must play ball, and play ball they have not since last summer. Hence, the A-B-C upward correction and ongoing bear market scenario gains strength with each passing month of positive economic activity, regardless of the inflation it was created with.

hui

Enter once again the Macrocosm because it is time for a reminder to myself, if not you, that the macro must rotate negative in order for the gold-stock sector to be anything special. Speaking of rotation, it has been rotating alright, but with yields and inflation signals fading that rotation is not into a deflationary situation that would produce a big gold-stock buying opportunity but is instead something of an interim Goldilocks scenario (easing inflation expectations, firming USD, Tech and Growth bid up, etc. while the economy remains okay). Continue reading "Update: Gold Mining Fundamental Macrocosm"

Gold & Silver: Fed Boosted The Dollar

Last Thursday, the dollar rallied, reaching a two-month high versus major currencies, a day after U.S. Federal Reserve shocked markets by projecting a hike in interest rates and an earlier end to emergency bond-buying.

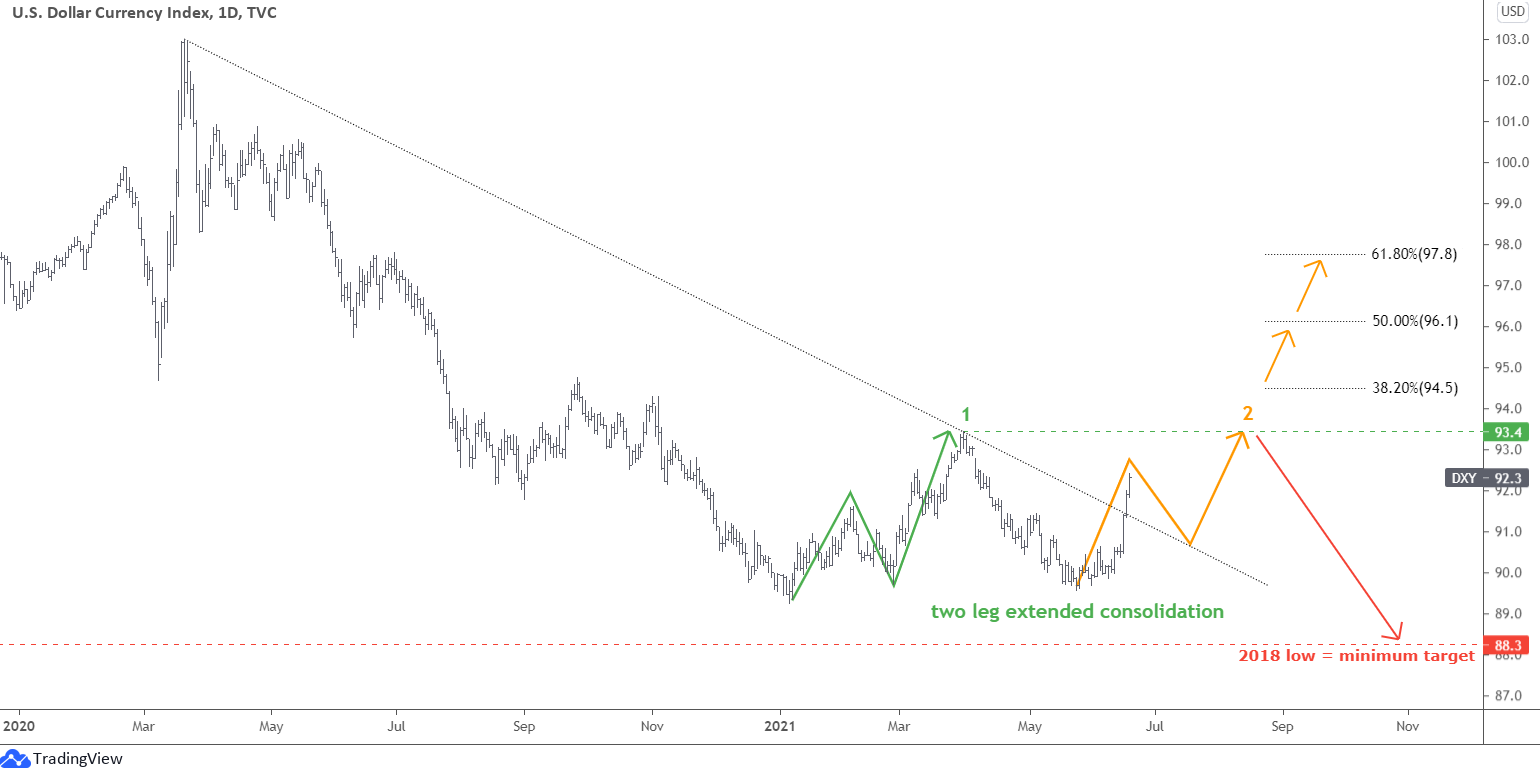
Daily US Dollar Chart

The price broke above the black dotted trendline resistance, which does not look like a minor correction. Instead, I think this is an extension of a large retracement of the entire move down that started in March of 2020.

The market could build the second leg of this large consolidation marked with an orange color. I highlighted the last leg with a green zigzag to the upside. The current leg up could repeat the same two-movement structure, so I built the orange zigzag. The first move within a second leg up could be over. I expect the upcoming pullback to retest the broken trendline resistance. After that, the retracement could resume and hit the top of the first leg at 93.4. Continue reading "Gold & Silver: Fed Boosted The Dollar"