Gold Update: This Move Is Too Big To Ignore

Every year ahead of Christmas I traditionally ask your opinion about the possible Santa Claus Rally in the precious metals market. Last time it was on the 10th of December. In that post, I shared my worries about the possible Grinch effect of the emerging strength of the US dollar (DXY index), which could spoil the rally at the end of the year.

Most of you believed that the Santa Claus Rally would happen despite the possible threat from the dollar’s strength. And like many times before you were absolutely right as both metals gained at the end of the year – gold’s price surged $50, and silver’s price jumped more than $1. Tremendous gains, bravo!

At the start of the New Year, I would like to update the medium term gold chart for you. Continue reading "Gold Update: This Move Is Too Big To Ignore"

Cyclical Assets Vs. Gold

In January of 2018, we noted a cyclical leader (Semiconductor Fab Equipment) in trouble: Semi Canary Still Chirping, But He’s Gonna Croak in 2018.

We also ran a series of articles featuring the happy-go-lucky 3 Amigos (of the macro) in order to gauge a point when larger herds of investors would become aware of cyclical issues facing the global (including the US) economy. Each Amigo (SPX/Gold Ratio, Long-term Treasury yields, and a flattening Yield Curve) would ride with the good times but signal an end to those good times when reaching destination (Amigos 1 & 2 got home but #3, the Yield Curve is still out there). Here is the latest Amigos status update from October: SPX/Gold, 30yr Yields & Yield Curve.

Today I would like to stick with a cyclical macro view, but do so through a lens filtered by the ultimate counter-cyclical asset, gold. As market participants, we are lost if we do not have road maps. That is why we (NFTRH) gauged Semi Equipment vs. Semi (and Tech), the unified messages of the macro Amigo indicators and many other breadth and cyclical indicators along the way to safely guide us to Q4 2018, which has been a challenge for many, but business as usual for those of us who were prepared.

But gold, which all too often gets tied up in an ‘inflation protection’ pitch by commodity bulls, is one of the best signalers of a counter-cyclical backdrop as its best characteristic is that of value retention and capital preservation. Gold, being outside the constellation of risk ‘on’ assets does not pay any income, does not leverage good economic times and does not inherently involve risk because it is a marker of stable value. Hence its underperformance during cyclical good times (leverage and all) and its outperformance during troubled counter-cyclical times.

So let’s take an updated look at gold vs. various cyclical items Continue reading "Cyclical Assets Vs. Gold"

Gold Extends Consolidation Giving Silver Another Chance

Gold and silver exchange leading roles in the market quite often, especially on the short-term charts. Last time I wrote about it silver saved gold from collapse at the start of this month. The white metal unexpectedly bounced off the earlier low reversing the drop of the yellow metal.

This time gold took the lead as its failure to break below the Bear Flag let silver lick its wounds and return above the $14 handle.

Both metals are still trapped in the middle of the range set by the earlier heavy drop, which first occurred in gold and then it was repeated in the silver market. In this post, I have focused on the local structure as the bigger picture remains unchanged.

Chart 1. Gold Daily: 3rd Leg Up Is Uncommon But Possible

consolidation
Chart courtesy of tradingview.com

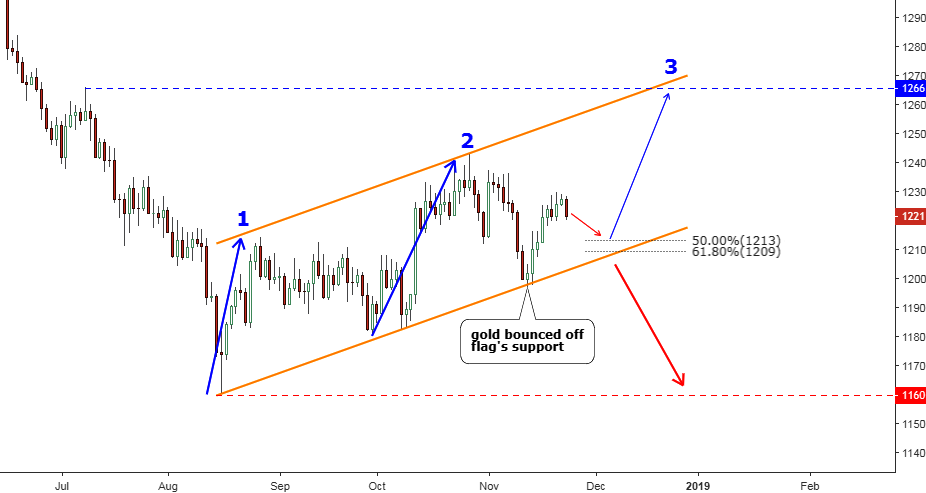
The top metal couldn’t break below the trendline support of a Bear Flag (orange) and then quickly restored most of its losses coming back above $1200. It is interesting that the forecasted drop unfolded quite differently in each metal. Silver tagged the earlier trough, but gold failed even to breach the vertically sloped trendline. It looks like strong demand appeared right at the round number of the gold price in the $1200 area. Continue reading "Gold Extends Consolidation Giving Silver Another Chance"

Gold & Silver: Falling Knives

Silver has failed to complete the second leg up as it couldn’t break above the August top of $15. It is interesting that this misbehavior of the white metal didn’t surprise you as the majority of you had bet last week that silver would fail and drop below $14.2. It’s impressive how accurate your forecast was!

In this post, I would like to update downside targets as we should be prepared for the resumption of the drop in metals after pullbacks have been finished.

Chart 1. Gold Weekly: Bear Flag Targets Bottom

falling knives
Chart courtesy of tradingview.com

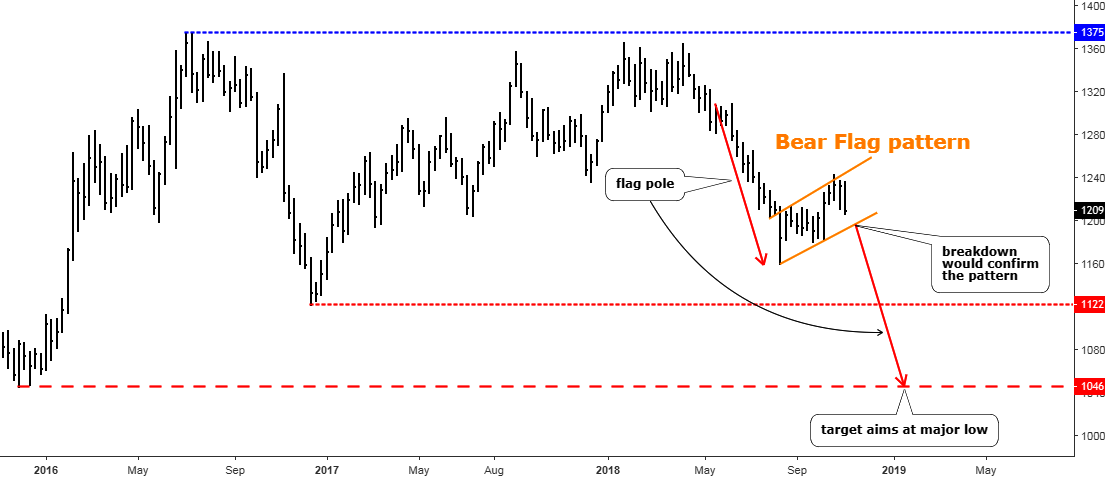
Last week I reminded you of the big range of trade, which requires the retest of the downside of the range to complete the setup. Continue reading "Gold & Silver: Falling Knives"

Silver Slows Saving Gold From Collapse

Chart 1. Gold Daily: Former Support Retested, Another Spike Is Possible

pullback
Chart courtesy of tradingview.com

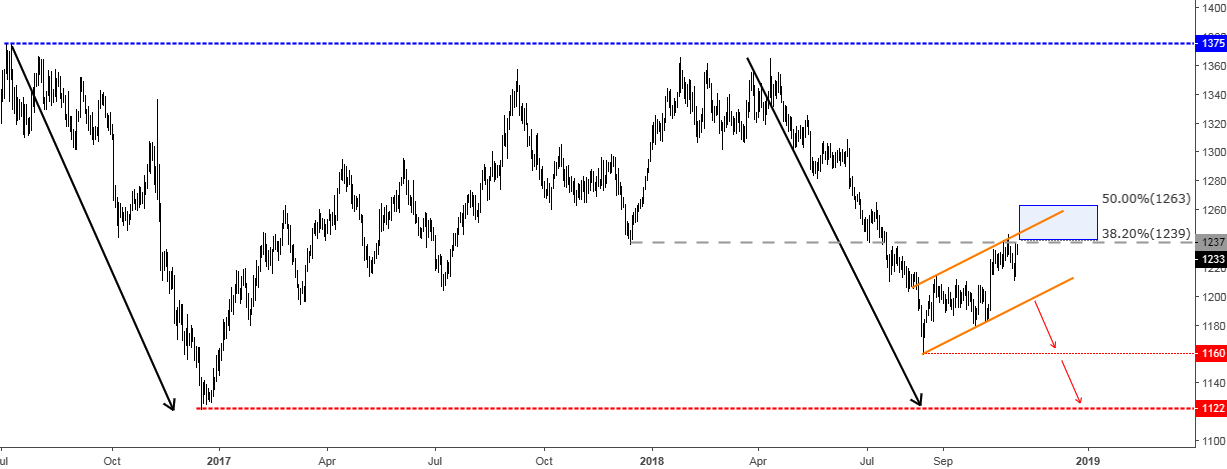
Gold has finally reached both the AB/CD target and the former support area of $1237 (gray dashed line) as it was forecasted last month in this chart. The metal hit the maximum of $1243 on the 26th of October and then dropped like a rock as was also anticipated after the completion of a pullback. Last Wednesday the price established a low of $1212 losing $31 (-2.5%) from the top. But at the end of last week, gold restored almost all of its losses, closing just below the former support at $1233.
Continue reading "Silver Slows Saving Gold From Collapse"