Gold Update: $1616?

Last month, after gold had missed our primary target of $1577 and then started to collapse, I wondered if "A Bear Face Was Showing Up?". The price was still above the trendline support, although it dipped below $1500. I also spotted the potential reversal Head & Shoulders pattern, which was adding to the possible Bear Face.

Let's see below what you had been expecting from the market these days.

Gold

The most of your votes in the earlier ballot were for the "No" option, which means you didn't think that gold had topped already keeping bullish outlook, no matter what. The thing is that we don't know the right answer yet, as none of the triggers were pushed. To remind you, the Bearish confirmation is only below $1400, and the Bullish one is above $1557.

I want to share with you the anatomy of the failed Head & Shoulders pattern below to show what has gone wrong for educational purposes in the 4-hour chart below. Continue reading "Gold Update: $1616?"

Gold Update: Is A Bear Face Showing Up?

Gold has missed our main target by $20 as it topped at the $1557 on the 4th of September. The gold optimists still benefited nicely as this peak was $67 above the first target of $1490, that we hit more than one month ago. So, it was definitely worth it to keep bullish for one more month.

Let’s see below if there were a lot of gold optimists a month ago.

Gold Poll

Indeed, the majority with a large margin preferred the continuation of the gold’s rally. It means you could book more than $60 for every ounce staying bullish. Thank you for support as I also believed in that outcome.

In the meantime, we should bear in mind that this was just a considerable correction, which had started in December of 2015. It has been retracing the other drop between 2011 and 2015. So, it is evident that the considerable drop and the correction are almost equal in time it took to emerge – 4 years both. Shall we book the recent rally as “done”? Continue reading "Gold Update: Is A Bear Face Showing Up?"

Gold Hit First Target

Last Wednesday gold had hit the minimum target of $1490 that we were waiting for since January when the price was at $1288. The target was clear, but the path was not and only this May the market eliminated one of three possible options. One month later, it has finally shown its real face leaving the single initial path to go.

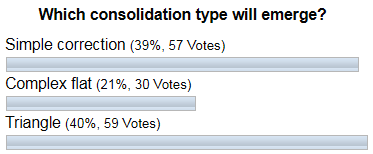
Last month gold advanced quite well, but it failed ahead of the first target. I spotted the consolidation on the 4-hour chart and shared it with you to reassure disappointed bullish traders as to when the price doesn’t reach the target someone could start to exit early. Consolidations are tricky by nature, and I showed you three possible types it could unfold. Let’s see below which one you liked the most.

Gold Poll

The triangular type was your first choice; the simple correction was the second with a minor gap, and the complex flat was the least liked. And again the majority of you were right as this was a triangle. Let’s see it in the updated 4-hourly chart below. Continue reading "Gold Hit First Target"

Gold Bugs, How Deep Is Your Love?

The title of my previous update was “Calm Before Storm”, and it was not “clickbait” as I spotted a telling market structure that appeared on the chart as a huge visible consolidation had emerged.

Indeed, a sharp move higher followed that post after the consolidation mentioned above had broken out. That move was strong enough to overcome the barrier of the potential triangle’s resistance above $1360. This has invalidated the second option (green arrows) of intermediate triangular consolidation on our master chart. As time goes by, the dust settles, and the chart structure gets clearer eliminating one option after another until only one single way to go remains.

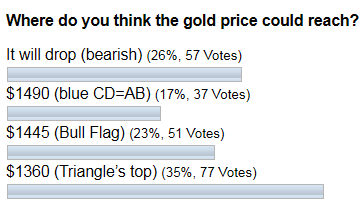
The gold advanced as high as $1437 so far, let’s see how you felt the market one month ago.

gold

Most of you thought that the triangle’s top could stop the market at the $1360 level, but at the same time, you were optimistic about the gold move although a bit conservative. It is interesting that in second place, the votes were given to an opposite bearish scenario. This confirms the idea that market forces are struggling during consolidation, as trading opinions are polar. There is a Bull Flag’s target on the third place, and it is the closest result so far, my congratulations to those who hit that option.

I cleaned the master chart below for you to focus only on one option, and I extended the view there. Continue reading "Gold Bugs, How Deep Is Your Love?"

Gold Update: Calm Before Storm?

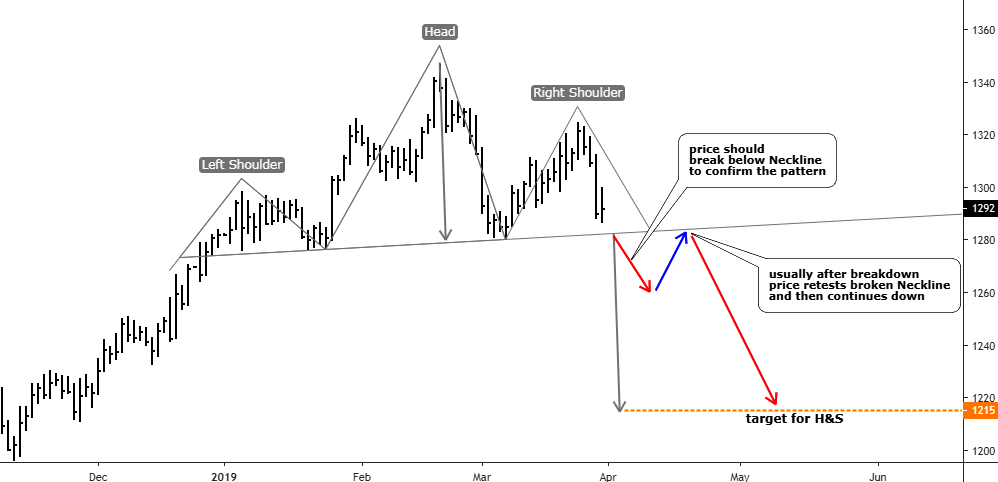
Last month I spotted the reversal Head & Shoulders pattern on the daily gold chart and shared it with you. Let’s see how it played out.

I entered the replay mode on the chart below and deleted the bars that appeared after the previous post to show you what I was expecting from the Head & Shoulders pattern. I would like to add more educational annotations for you in this post.

Head & Shoulders pattern
Chart courtesy of tradingview.com

The previous annotations were switched to gray except the target level for the Head & Shoulders pattern. So, what I was expecting to appear on the chart? First of all, there should be a breakdown below the Neckline, which would confirm the pattern (short red down arrow). Usually, after the breakdown, the price retests broken Neckline (blue up arrow). Only then, the market continues its move in the direction of a target (long red down arrow). Continue reading "Gold Update: Calm Before Storm?"