Gold, Silver & the Macro

Those micro managing the precious metals are fixating on the Symmetrical Triangle (bearish continuation) and a coming 'Death Cross' of the MA 50 below the MA 200.

The Sym-Tri has been apparent for about three weeks and the Death Cross is hype put forth by those who would make grand TA statements.  The Death Cross means next to nothing.  I mean, how much good did the Golden Cross that the "community" was pumping in March end up doing?

gold

Gold is bearish and has been bearish by its technicals (below the 50 and 200 MA’s), and ever since the economic soft patch was was put behind us (cold weather, remember?) by its apparent macro fundamentals as well.  NFTRH has been keeping this situation locked down and in a box for future reference.  The box will be opened when the time is right.

Meanwhile, I'd suggest that people avoid micro managing gold.  It is not an idol or a religion, and while there is a whole industry champing at the bit to begin promoting it again, it is just a tool for retaining the value of money.  Sometimes tools sit in the toolbox.

As for silver… Continue reading "Gold, Silver & the Macro"

Big Pictures: Stocks, Gold and the Miners

Ukraine war hype, China demand drop, GOFO mysteries… these are the short term noise inputs on the gold sector.

US Treasury bond yield spreads, gold vs. commodities (i.e. the 'real' price of gold), gold vs. the stock market… these are some of the fundamental considerations that actually matter and they have taken a hit since January.

It is easy to say 'I am bullish in the big picture' (measured in years) but it is not so easy to actively manage in the smaller pictures (measured in days, weeks and months) with all of the above noise inputs and more bombarding the poor individual player.

We use shorter term charts to manage the shorter time frames.  Daily charts have most recently indicated a bearish set up as bear flags formed across the precious metals complex (with the exception of silver, which never got going to begin with) last week.  Weekly charts continue to indicate that an extended and oh so grinding bottom may be forming, but that includes the potential for ups and downs, also known as volatility. Continue reading "Big Pictures: Stocks, Gold and the Miners"

Chart of The Week - Gold

Each Week Longleaftrading.com will be providing us a chart of the week as analyzed by a member of their team. We hope that you enjoy and learn from this new feature.

After a week where we saw a correction in stock index futures, we will be looking at June Gold Futures (NYMEX:GC.M14.E) to receive a possible flight-to-safety bid. The focus remains on the Russia-Ukraine conflict, where the prospect for violence is extremely high. This shifts the gold market’s focus from physical commodity fundamentals to safe haven issues. Further Russia-Ukraine tensions or continued pressure on stock index futures can provide an influx of buyers in the gold market.

On the technical side, gold has shown a lot of strength after rebounding from its April 1, 2014 low of 1278.3. Last Friday’s session was relatively quiet, consolidating and trading within the previous day’s range between 1324 and 1310.8. For this reason, along with multiple fundamental catalysts, I would be a buyer in June Gold futures and look for it to reach $1350.00 in the near future. Continue reading "Chart of The Week - Gold"

The Odds Are In Your Favor To Trade Gold This Quarter

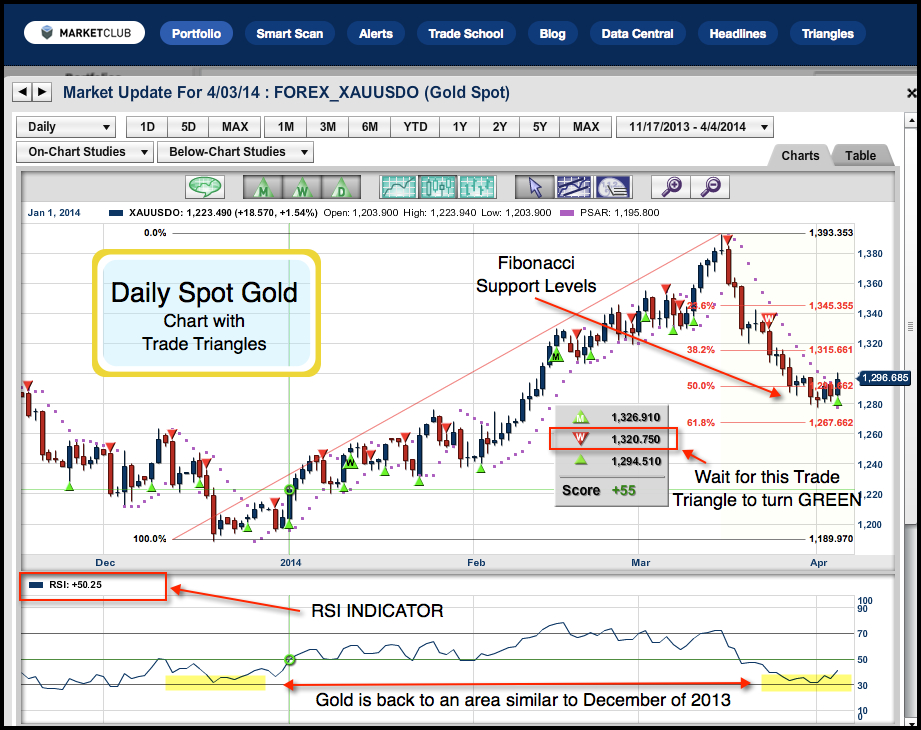
Using MarketClub's weekly and daily Trade Triangles, I have found that over the last 6 1/2 years, the second quarter of the year has shown the most consistent profits in gold. These past results showed a quarterly gain on average of $7,104.83 on one futures contract.

Gold (FOREX:XAUUSDO) enjoyed a nice move up earlier in the year, reaching a high of $1393.35 and has pulled back to an important Fibonacci support area. I want to watch this market very carefully and wait for the weekly Trade Triangle to turn green to get bullish on gold. That's not to say I am not longer-term bullish, it only means that my timing will kick in when the weekly Trade Triangle turns into a green Trade Triangle.

Besides the Fibonacci support area, the RSI indicator is also at a very low level, similar to that of December 2013. Continue reading "The Odds Are In Your Favor To Trade Gold This Quarter"

Gold Contrary Indicators

The gold sector is peopled by a high concentration of contrary indicators because it is a relatively (to the vast world of equities and bonds) small market that offers refuge from some of the damaging aspects of the spectrum of investment products that are supported by the manipulation of interest rates and printed (and digitally created) money supplies. Thus, gold has moral high ground if an asset can be thought to have morality.

More accurately, the people bullish on and promoting gold take high moral ground and that is where the emotional power comes from in this market. This power feeds upon the desires of regular people to not suffer the consequences of the 'evil' actions of those running a system that many do not agree with. Readers of this site know of course that I certainly don't agree with the setting and manipulation of interest rates by decree of man (and woman) in service to engineering desired outcomes in financial markets. Continue reading "Gold Contrary Indicators"