Pre-Fed Precious Metals Update

We review these metals as the media schleps all over itself trying to tell people why the Fed will cut 1/4, will cut 1/2, should not cut at all and/or why the president of these United States of America is on Twitter haranguing the Fed to be as disreputable as Mario Draghi and China’s central planners because they know how to play the game. It’s all a game after all, isn’t it Trump? You old currency warrior, you.

Copper daily is nesting on the SMA 50 but locked below resistance and the SMA 200. Still in bounce mode but very unspectacular.

copper

Copper weekly still looks pretty gross. It’s above critical support but locked below a ton of resistance. The 2016-2019 pattern also looks like a freak. I refuse to like industrial metals (or cyclical commodities in general) until I get some technical reason to like them. Continue reading "Pre-Fed Precious Metals Update"

Gold Update: Pitfall Or Pit Stop?

The mighty metal has almost hit the Bull Flag’s target, which was set two months ago. Gold was got close as it reached $1439 on June 25th and only had $6 left to reach that level. Usually, when the impulse of the price gets exhausted without breaking the important level or after it briefly penetrates the latter, then the price quickly retraces in the opposite direction. And that’s what we got with the gold price as the impulse initially looked strong enough to catapult the metal to the $1500 area, but suddenly it failed. Therefore, the price dropped back below $1400 to $1382. Then the buyers actively bought this drop up again to the former top, but they stopped just $1 below it and capitulated there as the price plummeted to $1386 back below $1400. These seesaw moves make traders nervous as it is dangerously volatile with more than $50 setbacks.

The question is if it is a pitfall and we shouldn’t expect any further strength of gold, or it’s just a pit stop to make a pause to accumulate a momentum for another push higher? Let’s look into the chart below to try to figure it out.

I dipped into the 4-hour time frame to show you what happens there.

Gold
Chart courtesy of tradingview.com

First of all, I would like to point out that I believe that we are just in a correction before another push higher, so I choose the pit stop option for the gold. Therefore, my chart will be based on this idea. Continue reading "Gold Update: Pitfall Or Pit Stop?"

Gold Stock Launch In The Books; What's Next

You may know me as the…

gold

…guy.

The guy using the planets of an imaginary gold sector Macrocosm with proper fundamentals that are decidedly not imaginary but rather, are necessary to call a real bull phase or even bull market. By managing a strict set of macro and sector fundamental inputs (to the sound of crickets and little else in the sector) NFTRH and its subscribers had a front row seat to the now obvious gold mining launch as first the fundamentals came in line, followed by the technicals.

The reason this needs to be highlighted is because there is a popular Elliott Wave analyst out there * (among a few others) talking about how it’s all in the wave counts (unless they are revised, as often happens with EW) or other technicals, and fundamentals don’t matter. As if the answer is all technical and sentiment based. Well, those two things are important, but please. As happened in dramatic fashion when we became super bullish in Q4 2008, the fundamentals kicked in first and gave a green light to taking technical signals more seriously along the way. Look, I am a TA too, but The Men Who Stare at Charts exclusively are pitching only half the story. Continue reading "Gold Stock Launch In The Books; What's Next"

Gold Bugs, How Deep Is Your Love?

The title of my previous update was “Calm Before Storm”, and it was not “clickbait” as I spotted a telling market structure that appeared on the chart as a huge visible consolidation had emerged.

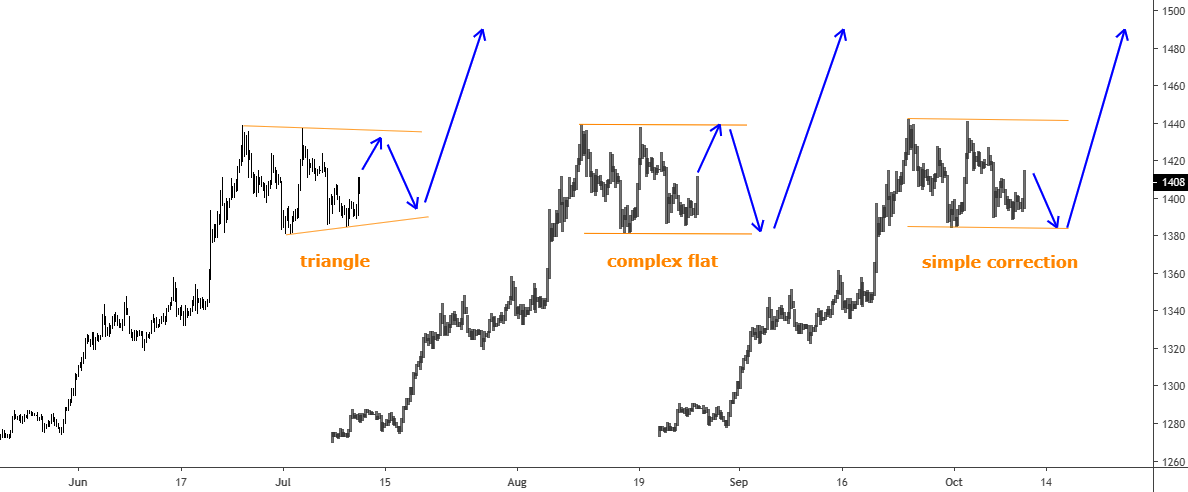
Indeed, a sharp move higher followed that post after the consolidation mentioned above had broken out. That move was strong enough to overcome the barrier of the potential triangle’s resistance above $1360. This has invalidated the second option (green arrows) of intermediate triangular consolidation on our master chart. As time goes by, the dust settles, and the chart structure gets clearer eliminating one option after another until only one single way to go remains.

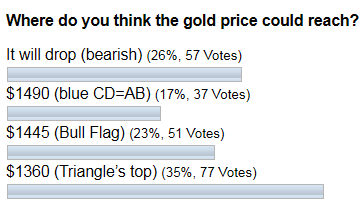
The gold advanced as high as $1437 so far, let’s see how you felt the market one month ago.

gold

Most of you thought that the triangle’s top could stop the market at the $1360 level, but at the same time, you were optimistic about the gold move although a bit conservative. It is interesting that in second place, the votes were given to an opposite bearish scenario. This confirms the idea that market forces are struggling during consolidation, as trading opinions are polar. There is a Bull Flag’s target on the third place, and it is the closest result so far, my congratulations to those who hit that option.

I cleaned the master chart below for you to focus only on one option, and I extended the view there. Continue reading "Gold Bugs, How Deep Is Your Love?"

Gold Miners Waiting On This Chart

It’s not a chart of nominal HUI with upside technical targets. We’ll do that in NFTRH this weekend, along with the usual individual miners. Rather, it’s a companion to other charts we’ve been reviewing over the last several months showing the undervaluation of the gold stock sector relative to gold’s performance vs. cyclical assets/markets. For example, gold has risen strongly vs. the CRB index and that is a sector fundamental undervaluation.

gold crb ratio

But on the macro picture, do you think that maybe gold stocks would benefit if gold manages to turn up vs. the US stock market? This chart appears to hold the key. HUI has been in a beautiful correlation to Gold/SPX since the 2011 top. To this point, the ratio has not turned up but you can see why I harp so much on the need for Au/SPX to get in gear. If it does, and joins Au/CRB and others, hang on to your hats and prepare for some upside targeting beyond the bounces of the last few years. We’d then go from identifying value mode to acquiring targets mode. Continue reading "Gold Miners Waiting On This Chart"