Are The Markets Sending A Warning Sign?

After an incredible rally phase that initiated just one day before the US elections in November 2020, we’ve seen certain sectors rally extensively. Are the markets starting to warn us that this rally phase may be stalling? We noticed very early that some of the strongest sectors appear to be moderately weaker on the first day of trading this week. Is it because of Triple-Witching this week (Friday, March 19, 2021)? Or is it because the Treasury Yields continue to move slowly higher? What’s really happening right now, and should traders/investors be cautious?

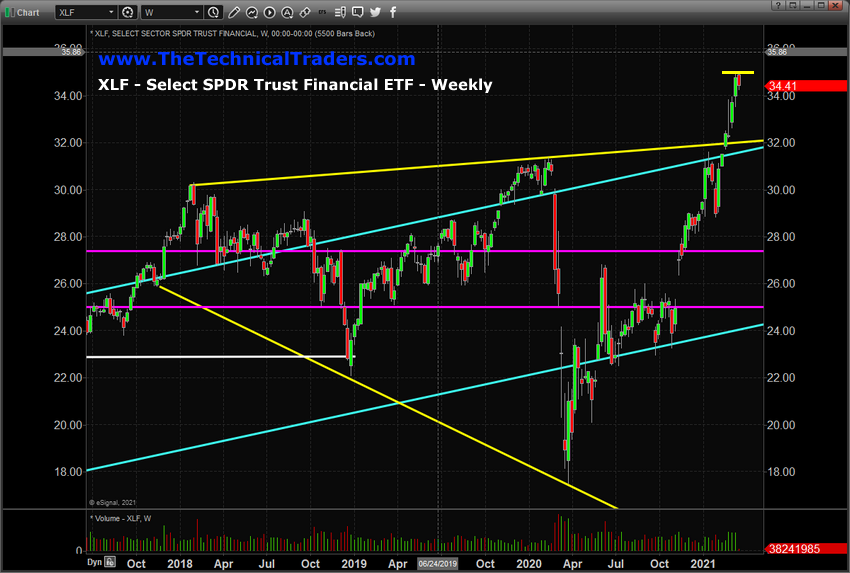
The following XLF Weekly chart shows how the Financial sector rallied above the upper YELLOW price channel, which was set from the 2018 and pre COVID-19 2020 highs. Early 2021 was very good for the financial sector overall; we saw a 40%+ rally in this over just 6 months on expectations that the US economy would transition into a growth phase as the new COVID vaccines are introduced.

We are also concerned about an early TWEEZERS TOP pattern that has set up early this week. If the price continues to move lower as we progress through futures contract expiration week, FOMC, and other data this week, then we may see some strong resistance setting up near $35.25. Have the markets gotten ahead of themselves recently? Could we be setting up for a moderately deeper pullback in price soon?
markets

The following SSO, ProShares S&P 500 ETF Weekly chart, shows a similar setup. Although the rally in the SSO is not quite the same range as the XLF, we see a solid TWEEZERS TOP pattern setup on the SSO chart over a period of many weeks. We also found the moderate weakness in the US indexes interesting this morning. Last week, we continued to see very strong buying trends. Today, we see those trends have almost vanished. Are the markets setting near highs waiting for some announcement or news to push them into a new trend? Continue reading "Are The Markets Sending A Warning Sign?"

Financial Sector ETF May Break Below Price Gap

Our research team warned of a peak in the Financial Sector ETF on June 10, 2020, with this article.

It was important to understand the technical setup that existed at that time and what the Fibonacci Price Modeling system was showing then. There was very clear support near $23 that was highlighted by the Fibonacci Price Modeling System, and we were very clear in our future price predictions within that article.

"The $27 price peak sets up directly between our two Fibonacci Daily upside price target (Peak) levels. We believe this setup is a very strong indication that a move to below $23 may be setting up over the next 30+ days. The Q2 data may very well push investors to re-evaluate the potential for the Financial sector if delinquencies and at-risk borrowers continue to default in greater numbers."

The timing of our original article could not have been better for skilled technical traders. Since that June 10, 2020 article posted, the XLF price has fallen almost exactly to $23 (-10.15%).

Currently, the FLX price is recovering just above the price gap that will act as the next "window" for the price to attempt to fill. Skilled technical traders should watch Continue reading "Financial Sector ETF May Break Below Price Gap"

How to Perform Serious Sector Analysis Using ETFs

In today's video, I'll be examining nine different sectors of the economy and analyzing their trends using SPDR ETFs. Out of the nine different sectors, I'll be looking at three of these sectors with strong uptrends, while the remaining six sectors are in a transition stage.

I will, of course, be applying the Trade Triangle technology to each of these nine sectors so you can clearly see how to put each of these sectors to work you.

Creating an ETF sector portfolio is easy and is not as difficult as you may imagine. The first thing you need to do is create a separate portfolio in your Portfolio Manager and enter these nine ETF symbols. Continue reading "How to Perform Serious Sector Analysis Using ETFs"