As many of us know China is becoming a bigger shareholder in the US then our citizens, which scares some and for good reason! But what does the long term look like for China? Whatever it is, it now directly impacts the US, so I've asked Doug Fabian to come and give us his thoughts on the ETF's that track China and the indexes. If you are interested in ETF's of ANY type, then I HIGHLY recommend you read the article below and check out Doug's newsletter HERE. I'm a member of his Mutual Fund Lemon List as I was a big believe in mutual funds. So enjoy the article and learn more about Doug HERE.
====================================================================
For the last 30 years, the economy that has achieved the fastest and most consistent growth in the world may well be China’s. Despite the current global recession, the Chinese economy still grew 9.8% in 2008. It marked the first year of single-digit percentage growth for the country since 2003, after notching double-digit percentage growth between 2003 and 2007.
Chinese government officials claim that their nation contributed more than 20% to the world’s economic growth last year. They also optimistically forecast economic growth of at least 8% for this year. However, a number of independent private sector estimates, including those from Economist magazine and the International Monetary Fund, estimate China’s economic growth will fall below 7% and possibly slip to 6%. A fear exists that civil unrest may occur if the growth rate dips below 8%, since economic weakness typically boosts unemployment. With relatively high growth rates, compared to other countries, investors may wonder if China could offer a hedge against recessionary conditions elsewhere.
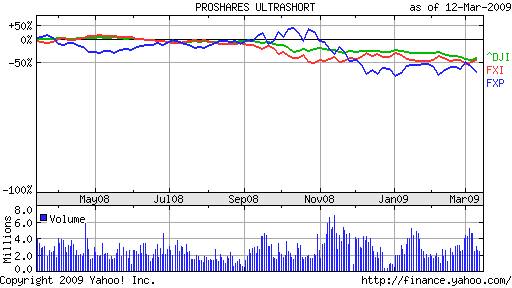
If 2008 is any indication, investors should tread cautiously before going either long or short in the Chinese market. Despite the country’s growing economy, history shows that the correlation between global stock markets increases during times of recession. As the Dow fell 33% last year, the Shanghai Composite Index plunged 65%. The iShares FTSE/Xinhua China 25 (FXI), an exchange-traded fund (ETF) that follows 25 companies on the Shanghai stock exchange, fell 47.76% last year. If you were shorting the Shanghai stock exchange through UltraShort FTSE/Xinhua China 25 (FXP), you would have lost 53.61%. You might expect a short ETF to turn a profit if the stock index that it tracks plummets but China certainly did not follow that pattern last year.

Despite the positive spin that Chinese government officials are giving to the country’s economic outlook, it is hard for me to belief that its stock market is ready to rebound. But that hasn’t stopped its leaders from expressing renewed confidence in its economy. The Chinese government reported last week that its industrial output last year rose by 5.7%, while its retail industry grew by 17.4%, year-on-year. In addition, China has nearly $2 trillion in reserves and a low debt-to-GDP ratio of 18%, compared to 80% in the United States and 160% in Japan.
On the other hand, other economic signs indicate a significantly slowing economy in China. Its exports fell in February by a whopping 25.7%. Millions of people have been left jobless and thousands of export firms have closed shop. With consumer prices falling, some analysts are discussing the possibility of deflation in China.
Since investors hate uncertainty, China is not looking very enticing right now. Of course, if investors decide stock markets around the world have been pounded enough and the current bear market rally may be a sign that the worst is behind us, China’s beaten down stock market could rally as strongly as any around the globe.
Personally, I am not yet ready to move into China either long or short. If you, however, think that the Chinese market has bottomed out and that its government stimulus spending will give the Chinese economy a boost, you may want to consider going long. For those who expect more fallout in the Chinese market this year, you may be tempted to put a little money into a short ETF. But if you’re like me and you dislike losing money and investing without a clear market direction in sight, you can monitor these ETFs from the sidelines along with the Fabian team.
LONG: iShares FTSE/Xinhua China 25 Index (FXI)
PowerShare Gldn Dragon Halter USX China (PGJ)
SPDR S&P China ETF (GXC)
SHORT: Ultrashort FTSE/Xinhua China 25 Index (FXP)
Doug Fabian
If you want guidance about which ETFs to trade and when, check out my ETF Trader service by clicking here.
 Today I'm going to take another quick look back at a popular ETF USO, or United States Oil. You'll quickly see how the MarketClub "Trade Triangle" strategy is working in this market.


