Is The Bitcoin Crash Over?

The cryptocurrency Bitcoin hit its most recent all-time high just over a year ago, on November 10th, 2021, at $69,000 per coin. More recently, Bitcoin was trading in the $16,000 range, that's more than a 76% decline.

Long-term Bitcoin bulls will be quick to point out that since its inception, Bitcoin has experienced other declines that fall within the same percentage drops. However, knowing that type of move has happened in the past, and the cryptocurrency rallied back probably doesn't help those who bought Bitcoin up at the highs feel much better about their investment.

But what about if you have been sitting on the sideline, waiting for the right time to buy Bitcoin? Is today a good time to buy the cryptocurrency?

For all the bulls out there, I already know I have been wrong about Bitcoin in the past, and I am wrong again this time. But hear me out before you write me off. I believe there are a few reasons why we have not seen the bottom of the current Bitcoin crash.

First and foremost, we are heading straight toward a recession. You may not want to believe it or face reality. Still, it is coming.

Just last week, Federal Reserve Chairman Jerome Powell told investors that the likelihood of a soft landing was rapidly diminishing. Inflation is still high, and Fed Members have made it clear that bringing down inflation is the most important problem to tackle now. And despite interest rates at levels we have not seen in a decade, the Fed believes we will still need more increases in the coming months.

The coming recession is important for Bitcoin's price because up until this point, Bitcoin has not proven to be a "safe haven" asset.

Furthermore, even gold, an investment that most investors would consider pumping money into during uncertain economic times, has not been rallying during this market downturn.

Many investors point to the fact that the dollar has strengthened as one reason why gold and cryptocurrencies are down. A strong dollar could be due to Treasury bonds paying higher and higher yields. The world considers the US Treasury Bond as the baseline for a zero-risk investment. And with T-Bond yields going higher in 2022, investors worldwide have been flocking to both the dollar and T-Bills. Continue reading "Is The Bitcoin Crash Over?"

Who Let The DOGE Out?

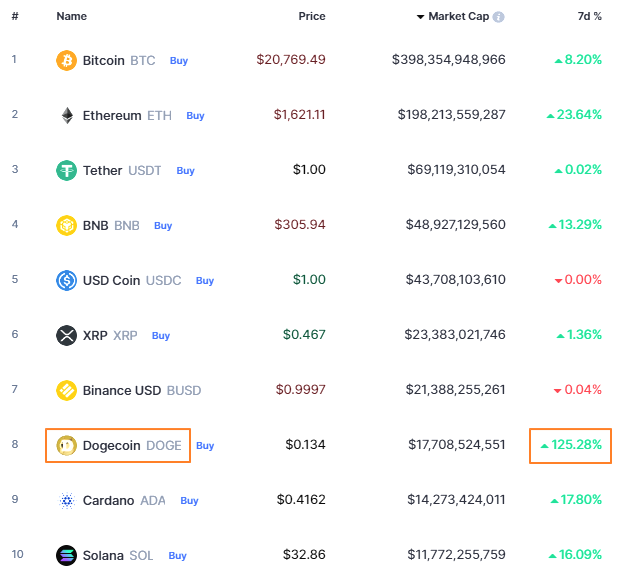
Last week the top ten cryptocurrencies ranking was reshuffled as Dogecoin (DOGE) shot straight to the eighth place with a market cap just under $18 billion. If we skip stable coins and exchange related coin BNB then this meme coin seized the #4 spot right below the Ripple (XRP).

If we look at the seven-day performance of top ten cryptos in the table below – none of them could boast the triple digit gain that we see in Dogecoin with +125% growth.

If this rally stays intact, the Ripple could lose its #3 spot soon. The price of the DOGE should add another 1/3 to 18 cents for this to happen.

top 10 coins

Source: coinmarketcap.com

What has fueled such a strong rally of this coin? The main reason is the hope that comes with the final takeover of Twitter by Elon Musk, who is a big fan of the DOGE and he pledged to support this meme coin.

Let me show you the anatomy of the rally in the 3-hour chart below. Continue reading "Who Let The DOGE Out?"

Bitcoin and Ethereum: No Safety Net

Earlier this month, I updated on the crypto market with a title, 'It Ain't Over Yet". I considered the recent strength in the main cryptocurrencies a "dead-cat bounce" within a classic sideways consolidation with a high probability of resuming collapse.

This time, I spotted new signals as the chart moves to the right building new bars over time. Let us start with the main coin in the weekly chart below.

Bitcoin Weekly Chart

Source: TradingView

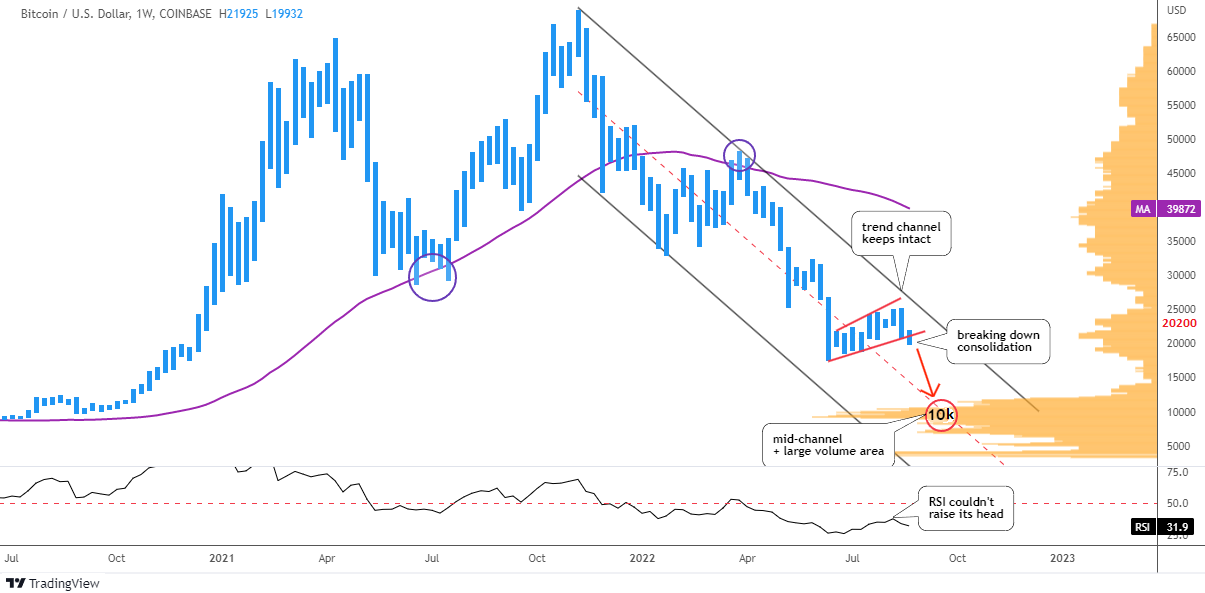
The price of Bitcoin moves within large bearish trend channel (black). The top of above-mentioned sideways consolidation within red trendlines did not even approach the resistance, it stays intact.

The RSI indicator could not raise its head to test the “waterline” of 50 level. This means that the market has considered this short-term strength as a "dead-cat bounce" as well.

The chart bar of last week has punctured below the red support. This is a harbinger of another drop. The main coin indeed is looking into the abyss as the strong support appears only after the price halves down. The largest area of the Volume Profile histogram (orange) is located between $9k and $10k. The mid-channel (red dashed) fortifies that support with its intersection.

Your biggest bet last time was the drop of the Bitcoin down to $12.2k, where the second leg down is equal to the first one. It almost coincides with the above-mentioned double support.
The next volume area is located at the $4k level and this option was your least favorite.

This time I added the simple moving average (purple) covering the preceding 52 weeks (1 year). It has been offering a strong support to the price starting from 2020. This year it has flipped to become a strong resistance after the price has dropped below it. The $40k level is the barrier to break to confirm the new bullish cycle.

A rather interesting situation has developed for the main coin. The price should either half down to find support or it should double up from this level to crack the bearish cycle. Continue reading "Bitcoin and Ethereum: No Safety Net"

Ride the Crypto Dip with this Bitcoin ETF

In late June, the ProShares Short Bitcoin Strategy ETF (BITI) began trading. BITI is the first inverse or ‘short’ Bitcoin exchange-traded fund in the US. The purpose of this ETF is to give investors a way to profit if the price of Bitcoin falls.

The fund didn’t seem to be well received the first day it was available to investors, but in just its first nine days of trading, it grew its assets enough to make it the second-largest Bitcoin-focused ETF listed in the US. The largest is ProShares Bitcoin Strategy ETF (BITO), which has over $680 million in assets while BITI has just around $59 million in assets under management.

There is really nothing super special about BITI other than the fact that it is the first time investors can short Bitcoin with an exchange-traded product specifically designed to do just that task. However, the timing of BITI being released on the market is interesting, to say the least.

First, Bitcoin just wrapped up its worst month in the 12 years that it has been traded on exchanges. Yes, you read that correctly. June 2022 was the worst month Bitcoin has had in 12 years. Bitcoin lost 38% of its value in June. Let that sink in.

Since Bitcoin peaked in November of 2021 at $69,000, the cryptocurrency is now down around 71%. (This is not the worst decline Bitcoin has had; in 2018 during the last ‘crypto winter’ Bitcoin lost more than 80% of its value.

Furthermore, a recent report about Bank of America’s internal customer data shows that the number of active crypto users has dropped by 50%, from 1 million in November 2021, to below 500,000 in May 2022.

The price of Bitcoin and other major cryptocurrencies has been crushed lately, but so has the number of active users. These two numbers are likely interconnected, but also show that the public's interest in Bitcoin, and perhaps even other cryptocurrencies, is waning.

And lastly, the SEC just denied the application to convert the Grayscale Bitcoin Trust (GBTC) into a spot bitcoin ETF. Many believe that if and when the SEC allows a spot Bitcoin ETF, new investors will flood the markets since many believe the structure of a spot ETF is much better than a futures-based ETF.

This leads us back to the idea that the timing for the Bitcoin Short ETF was interesting, or just even straight bad. Now granted, ProShares filed with the Securities and Exchange Commission to offer this Bitcoin short ETF back in February 2022, but that doesn’t help the fact that it didn’t hit the market until after a lot of bad news and low prices have hit Bitcoin and the rest of the cryptocurrency industry.

If ProShares had come to market with the Bitcoin short ETF just a few months or even weeks prior, investors could have caught a wave of bad industry-wide news, like the collapse of a stablecoin and a number of crypto firms falling into financial troubles, needing cash infusions or announcing layoffs.

With Bitcoin down 71% from its peak, or 38% in just June alone, investors have to be asking themselves if the world's largest cryptocurrency has fallen too fast and/or too far.

How much more room does Bitcoin have to go? From $20k a coin to $10k? Maybe even $5k? Or have we seen the bottom at $17k?

It is hard to say where Bitcoin goes from here, especially in the short term. But it isn’t very easy to get short or go long an investment after it has already made a big move in that direction, such as getting short after it's already down 38% in a month and 71% since November.

With that all said, beggars can’t be choosers. We didn’t have a short Bitcoin ETF before, and now we do. So, while the timing may not have been ideal, it is good to know that some investors are already taking advantage of this opportunity.

But, more importantly for me, I like knowing that I now have a viable option to short Bitcoin if and/or when I may find the opportunity to do so.

Matt Thalman
INO.com Contributor
Follow me on Twitter @mthalman5513

Disclosure: This contributor did not hold a position in any investment mentioned above at the time this blog post was published. This article is the opinion of the contributor themselves. The above is a matter of opinion provided for general information purposes only and is not intended as investment advice. This contributor is not receiving compensation (other than from INO.com) for their opinion.

Crypto Apocalypse?

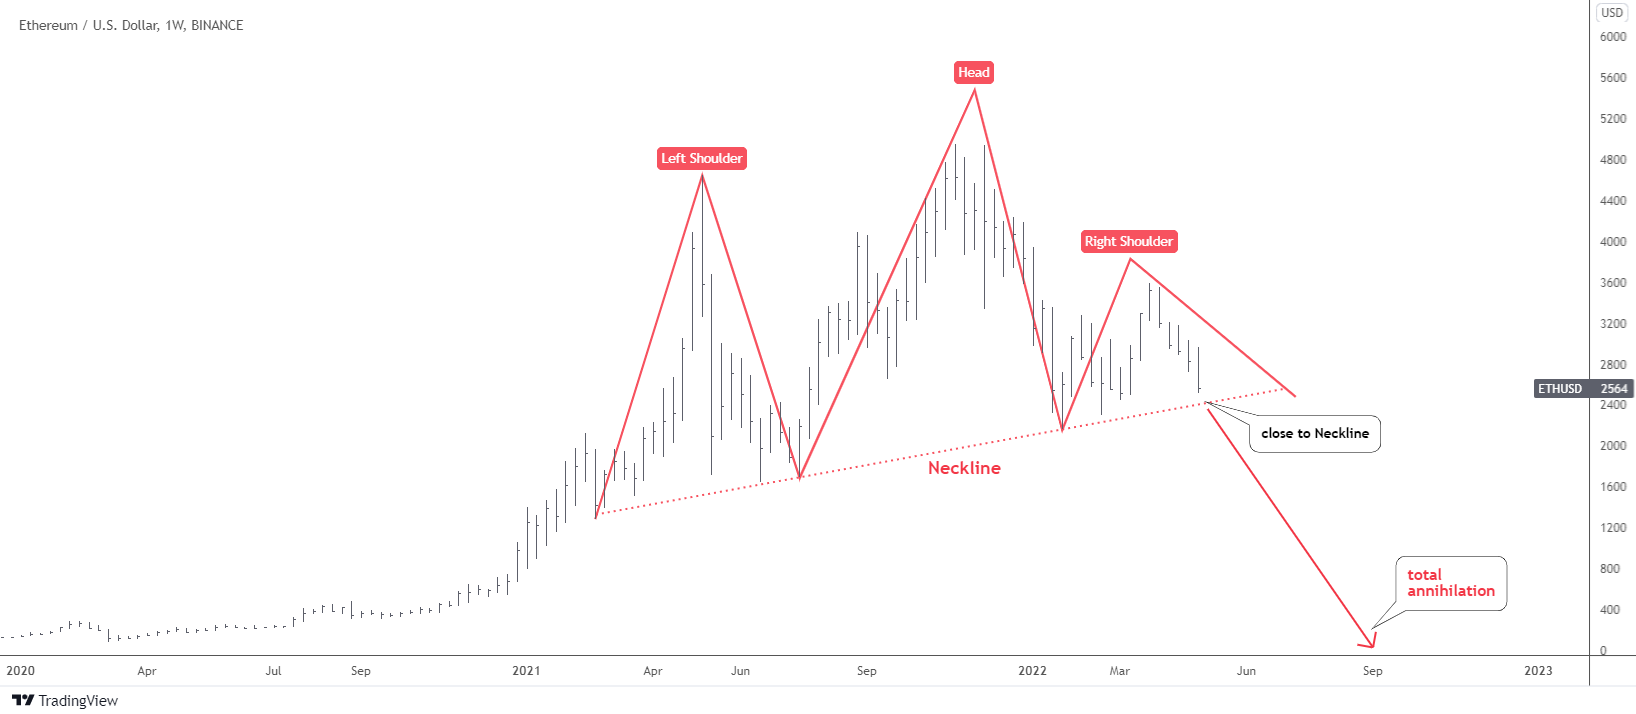
Ethereum (ETHUSDBIT) has an annihilation pattern in its chart and I would like to share it with you below as the price of the second largest crypto is approaching the trigger point.

Crypto - Ethereum Chart

You know this famous pattern very well as this model frequently appears in different instruments. I know it looks a little bit weird as the shoulders are not symmetric. However, all parts are in place, and the Head is the highest peak.

The failure to proceed to the upside after breakout beyond this February’s peak of $3,280 dried the demand for the second largest cryptocurrency; it has been building the small Right Shoulder of the pattern. The Neckline has been drawn through the valleys of the Head. Continue reading "Crypto Apocalypse?"