How Close Are The Markets From Topping?

Now that most of the US Major Indexes have breached new all-time price highs, which we called over 5+ months ago, and many traders are starting to become concerned about how and where the markets may find resistance or begin to top, we are going to try to paint a very clear picture of the upside potential for the markets and why we believe volatility and price rotation may become a very big concern over the next few months. Our objective is to try to help you stay informed of pending market rotation and to alert you that we may be nearing a period within the US markets where increased volatility is very likely.

Longer term, many years into the future, our predictive modeling systems are suggesting this upside price swing is far from over. Our models suggest that price rotation will become a major factor over the next 12 to 15+ months – headed into the US Presidential election cycle of November 2020. Our models are suggesting that the second half of this year could present an incredible opportunity for skilled investors as price volatility/rotation provide bigger price swings. Additionally, our models suggest that early 2020 will provide even more opportunity for skilled traders who are able to understand the true price structure of the markets. Get ready, thing are about to get really interesting and if you are not following our research or a member of our services, you might want to think about joining soon.

We are focusing this research post on the NQ, ES and YM futures charts (Daily). We will include a longer-term YM chart near the end to highlight longer-term expectations. Let’s start with the NQ Daily chart. Continue reading "How Close Are The Markets From Topping?"

Financials Setting Up An Island Top Formation

As we continue to scan the charts for setups and trigger to alert our followers, we’ve come across a setup that may be more ominous than what it appears. Recently we’ve posted articles about how the SPY and the NQ have pushed into new all-time high price territory and how Gold is setting up for a momentum base that should launch precious metals to near highs. We’ve also discussed how we believe the current upside price bias in the US stock markets should last another 10~35+ days before new price weakness sets up – possibly pushing prices lower in late May or early June 2019.

Our research team has been scanning the charts looking for anything that could give us an edge to the potential setup for this price weakness in the future. We believe the Transportation Index and the Financials could be keys to understanding how far the upside rally can continue and when a price peak may begin to warn of a potential price top or rollover.

An Island Top is a pattern that sets up with an upside price gap followed by sideways price action above that gap. In theory, this type of setup should promote the gap to be filled with downside price action before any further upside price move can continue. Although, gaps to the upside are fairly common in strong uptrends. Given the strength of the earnings data released early this week and the expectations that we have for some continued upside price bias over the next 10~35+ days, we are watching these Island Top formation in the Financials for any signs of weakness to alert our followers. Continue reading "Financials Setting Up An Island Top Formation"

Keep An Eye On The Financial Sector

A very interesting price pattern is setting up in the financial sector that could lead to a very big move in the US and Global markets. Remember how in 2008-09, the Financial sector and Insurance sector were some of the biggest hit stock sectors to prompt a global market crisis? Well, the next few weeks and months for the financial sector are setting up to be critical for our future expectations of the US stock market and global economy.

Right now, many of the financial sector stocks are poised near an upper price channel that must be breached/broken before any further upside price advance can take place. The current trend has been bullish as prices have rallied off the December 2018 lows. Yet, we are acutely aware of the bigger price channels that could become critical to our future decision making. If there is any price weakness near these upper price channel levels and any downside price rotation, the downside potential for the price is massive and could lead to bigger concerns.

Let’s start off by taking a look at these Monthly charts… Continue reading "Keep An Eye On The Financial Sector"

Crude Oil Hits The Target Early

Back in February, I wondered: “How Far Could Crude Oil Go?” As this commodity confirmed the upside reversal breaking above $54.6. We are still living in a “PetroWorld” therefore the price of oil is crucial, and it impacts all of us around the globe. So, we should watch it carefully.

I spotted a structural similarity on the weekly chart, which was cloned and applied to the current pullback of oil price on the lower time frame daily chart. The price target was set at the $63.7 and the time goal was set on the 6th of May, 2019.

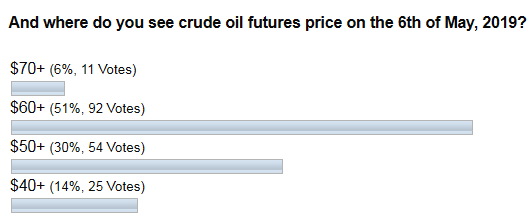
Before we move on to the updated daily chart, I would like to show you the results of your ballot on this topic.

oil price

I can’t express all my gratitude for your voting activity and support of my experiments. The results in the diagram above show that you also saw the area above $60 as a target for the current pullback. It is yet early to say if the price has topped already, but our initial target was achieved and even was passed over ahead of time.

In another ballot, you voted for the instruments you liked the most. Continue reading "Crude Oil Hits The Target Early"

Crude Oil Nearing Resistance

The recent recovery in Crude Oil has, partially, been based on increasing expectations of a global economic recovery taking place and the continued news that the US/China will work out a trade deal. Crude inventories. Just last week US Crude Oil inventories came in at +7.2 million barrels vs. expectations of -425,000 barrels (). Additionally, concerns in Syria and Libya are pushing prices a bit higher as well. Whenever there are supply concerns or uncertainty out of this region, prices tend to rise.

The facts remain very dynamic for Oil. The US is continuing to produce more and more oil and is expected to become a “net exporter” of oil this year. Economic issues will, eventually, resolve themselves, yet we don’t know the final outcome of these trade deals or how the economy will react to any milestones that are required within the final settlement. And, again, these continuing issues in Libya, Syria and near this region are likely to cause some increased levels of uncertainty over the next 60+ days.

Our researchers believe the $65.00 level will act as resistance to this current upswing. We believe the upside price move may continue to levels near $67.50 before weakening and beginning a topping formation. We believe our expectation that precious metals will bottom near April 21~24 is key to understanding the dynamics of this move in Oil. As long as FEAR does not enter the market, then Oil will likely react to impulse factors exclusively related to Oil. Once Gold breaks out above $1500 per ounce, our belief is that Oil will react to fear factors related to some broader economic event driving investors into precious metals. Continue reading "Crude Oil Nearing Resistance"