The copper futures hit an all-time high this spring. This is not a surprise to many readers who suspected it would - see the poll from late August.
The price has topped at $5.04, missing the preset target area between $5.36-$5.41. After that, copper futures collapsed below the valley of the last summer ($3.96) in the area of $3.60.
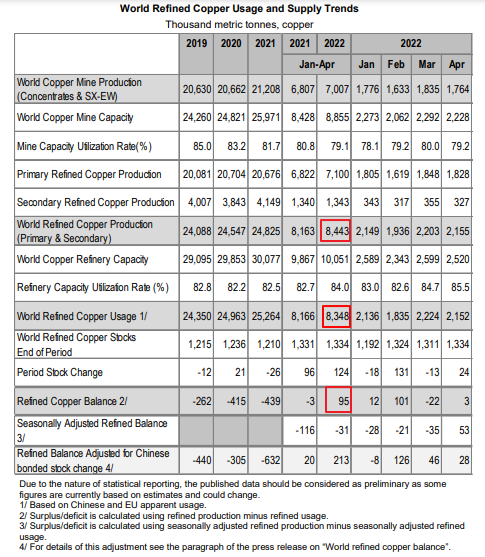
See the latest stats for the copper market in the table below.
According to the table above, the world refined copper production has increased to 8.44 million metric tons in the first four months this year, compared to 8.16 million metric tons for the same period last year.
At the same time, the world usage or demand has grown up either to 8.35 million metric tons in January-April this year from 8.17 million metric tons last year.
As a result, this year the copper balance turned into a surplus of 95 thousand metric tons compared to a deficit of 3 thousand metric tons last year. Moreover, if we take the last line of the table that shows the refined balance of the market adjusted for the Chinese bonded stock change is in even bigger oversupply of 213 thousand metric tons.
As we can see, the market fundamentals could have undermined the uptrend in the copper price in the first place. The following speed up of the futures collapse was fueled by the hawkish Fed, Chinese lockdowns and a new scaring mantra that has been circulating recently in the media about upcoming recession.
One could call it a self-fulfilling prophecy as last Friday the Atlanta Fed posted a second quarterly decline of a real GDP in a row on its GDPNow tracker. The second quarter reading is minus 2.1%, the first quarter reading was minus 1.6%. Technically speaking, this could mean that the forecasted recession is already here.
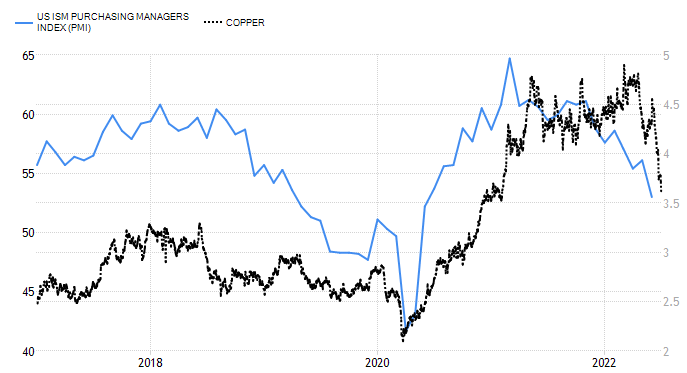
The auxiliary economic data from the graphs below also confirms the economic headwinds for the copper market.
United States ISM Purchasing Managers Index (PMI) (blue) fell to 53 in June of 2022 from 56.1 in May, demonstrating the slowest growth in factory activity since June of 2020, and below market forecasts of 54.9.
The robust uptrend of copper futures (black) in 2020 was in an accord with U.S. PMI until the start of 2021 where the factory activity has peaked and then started to collapse. The copper price firstly continued further up on the market inertia and then dropped huge to finally catch up with the current fundamentals.
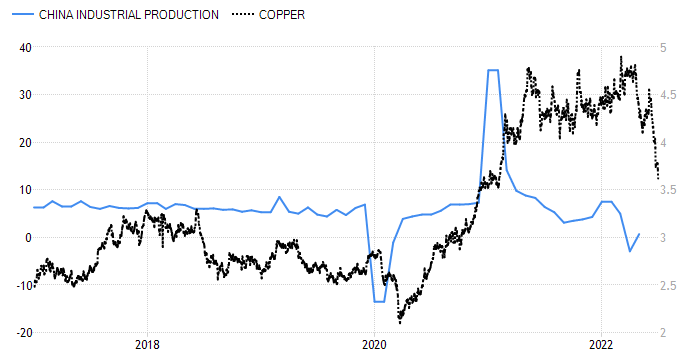
The similar situation has been seen in the chart above of Chinese industrial production (blue). The “World’s factory” performance has also peaked last year, ahead of the top in copper futures (black).
We could see here that the metal has more room to the downside into the $3 area to reach the corresponding level of Chinese data. It is worth to note that the industrial production in China has grown up by 0.7% recently after a relaxation in COVID-19 curbs in some major Chinese cities.
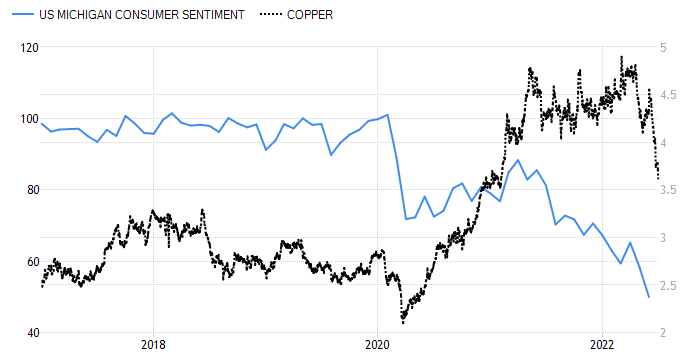
To complete the picture, we should look at the chart above that shows the U.S. consumer confidence (blue) as a main indicator of the initial demand.
The situation is even more depressed here as we can see no progress since the pandemic outbreak. The indicator just made a small rebound within the consolidation in 2020 and then continued to the downside to hit the record low of 50.0 in June 2022.
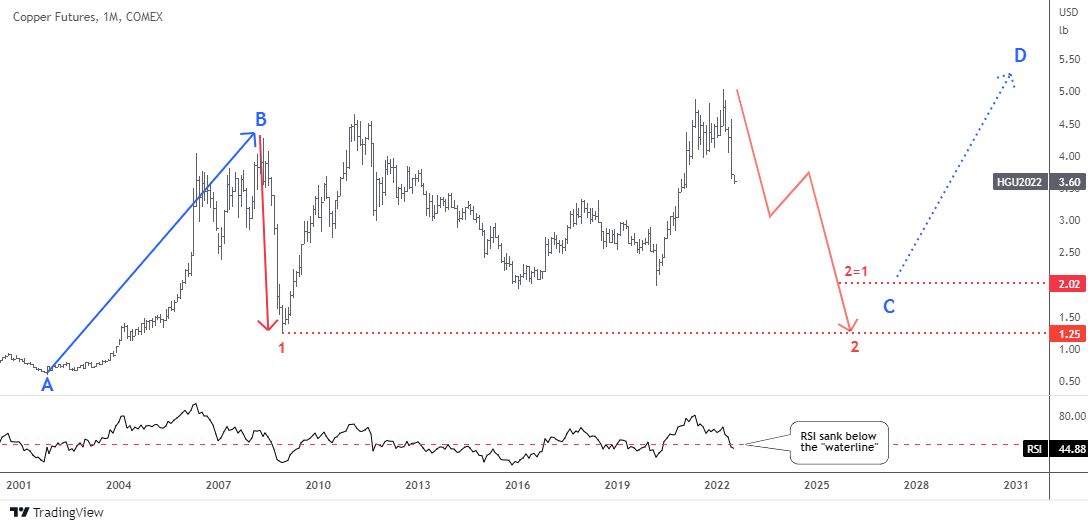
Let’s look at the updated chart of copper futures below.
The copper futures price goes well with the plan posted almost a year ago. It didn’t advance too much to the upside to fit with the extended consolidation pattern. We entered the red leg 2 down.
The latter could unfold either like the first straight leg down with a panic selling amid financial crisis of 2008 or it could build a zigzag with a corrective phase in the middle of the drop. More often than not, two legs are not alike.
Two possible downward targets could be set. The closest one is computed using the distance of the first red leg down subtracted from the new all-time high; it is aimed at $2.02. This area coincides with the valley of 2016 and 2020.
The next target is an old one as it Is located at the minimum of the first red leg down at $1.25.
The RSI sank below the so-called “waterline” beneath the crucial 50 level. If it closes this month there than the bearish trend is confirmed.
Intelligent trades!
Aibek Burabayev
INO.com Contributor
Disclosure: This contributor has no positions in any stocks mentioned in this article. This article is the opinion of the contributor themselves. The above is a matter of opinion provided for general information purposes only and is not intended as investment advice. This contributor is not receiving compensation (other than from INO.com) for their opinion.

