Gold Could Fly Over A Helicopter Throwing Money

On the 16th of March, when I wondered if “That’s It?” for gold it dropped for more than $100 to the low of $1451. It looked like the first move down in the large second leg of a huge complex correction.
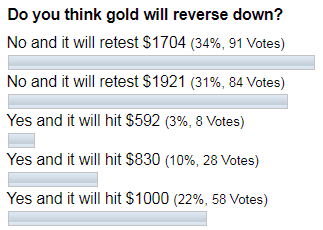
As we know, guessing tops and bottoms is a tricky exercise. So, the next move up was considered to be a correction as to confirm the top we should see the passing move down first (checked), then there should be a corrective move in the opposite (upside) direction and the next should be the continuation to the downside. Let’s see below if you thought gold would reverse down.

The majority of you remained bullish as you clicked on the “retest of $1704” and “$1921”. The first bet already paid well as the market retested the former top last Monday. This price move was quite sharp as previously the same distance unfolded by gold within only 82 daily bars from November 2019 till March 2020 compared to only 20 daily bars this time.

It looks like gold doesn’t want to drop as things changed dramatically. Continue reading "Gold Could Fly Over A Helicopter Throwing Money"

Silver Is A Game Changer

Last month I shared with you “Three Options To Go” for silver price, namely “Optimistic”, “Pessimistic” and the sideways option called “Extended consolidation” on one chart. Below are your bets for each option.

Silver

Most of you chose the “Optimistic” option where silver should continue to the upside after completing the correction. It’s a rare case when the minority was right as the “Pessimistic” scenario played out the next week after the post. The metal’s price dropped into the abyss at $11.64, reaching the 11-year low in the price area of distant January 2009. I think this move surprised not only me, although I said that it could reach $11 area, but even those who clicked the right answer as it was so quick as price sank within a few weeks from $16.66 for 30%!!!

Silver just can’t stop surprising us as it suddenly changes from latency mode to explosion mode and back, again and again.

The interesting thing happened next Continue reading "Silver Is A Game Changer"

Crude Oil Eyes $10

In February, I shared with you a "Buy Setup" for crude oil futures with a 1:6 risk/reward ratio. The trigger was set at $52.25, stop below $48.70, and the target was at $73.55. I always appreciate your kind support, as most of you liked that setup.

Oil Poll Results

I also asked you if you thought that crude oil had bottomed? Continue reading "Crude Oil Eyes $10"

Gold Update: That's It?

It’s really amazing to see how some people take a selfie every day from childhood and then compile a video from those photos to see the timeline of their life.

As gold reached all preset targets, hitting a new seven-year maximum of $1704, I think it’s an excellent time to contemplate the history of this large move up. I put the charts from the previous posts one by one to restore the timeline with my comments for you. Let’s start the time machine!

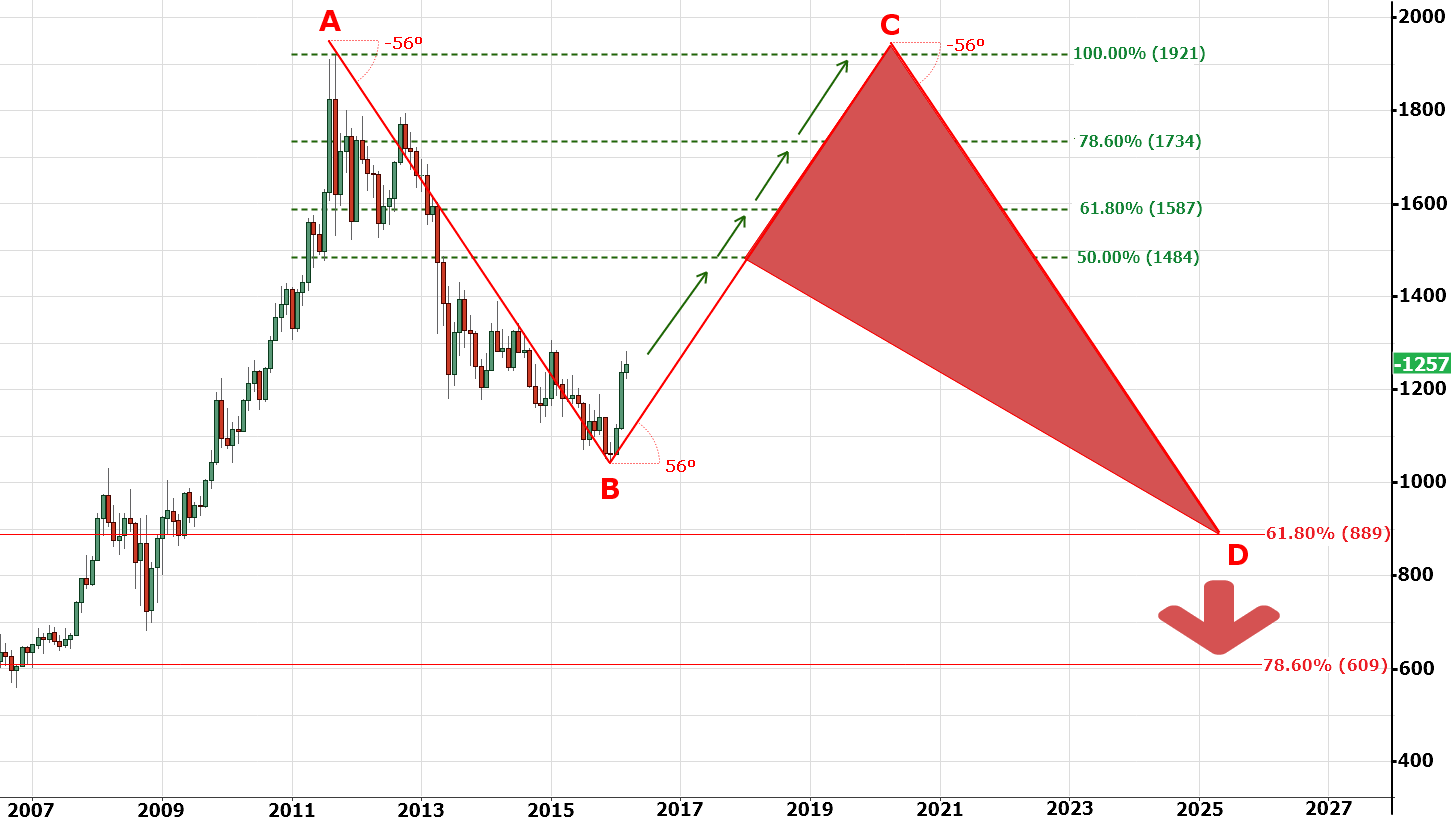
Chart 1. Global Monthly Chart Of 2016

Gold
Chart courtesy of tradingview.com

Four years ago, when the “Bulls Finally Took The Ball”, I posted a big map to share with you my view about a possible sizeable complex correction for gold to warn you of a time-consuming zigzag move. It was meant to become a real roller coaster with a big up and down move. It consists of two Fibonacci retracement areas. Green colored was set for the current move up. We almost reached 78.6% last week as price grew by $447 or 36% since that post in 2016. Continue reading "Gold Update: That's It?"

U.S. 10-Year Yield: It's Not "If" But "When"

Life is full of surprises as we never know what could happen next, and it is the true phenomenon of our existence. Last time I shared my thoughts about the U.S. 10-year yield (10Y) in September of 2018 calling for a rise to 3.33% and more. JPMorgan Chase CEO Jamie Dimon warned that time to be prepared for a 5% 10-year yield. Let’s take a look a what you thought then.

10-Year Yield

Most of you agreed with JPM’s CEO and hit the 5% option. The atmosphere then was so elevated that it was easy to believe that the rates would keep rising. Indeed, the market went higher but stopped at the 3.26% mark, and that was it. The least favored target of 3.33% appeared to be the closest call.

The precious metals’ posts schedule was busy here on the blog at the end of last year, so I posted my call at tradingview.com for 10-year yield to drop to tag the previous low of 1.34% on November 14th of 2019. Below is the chart of that post. Continue reading "U.S. 10-Year Yield: It's Not "If" But "When""