Gold Is Well-Behaved, But Silver Is Not

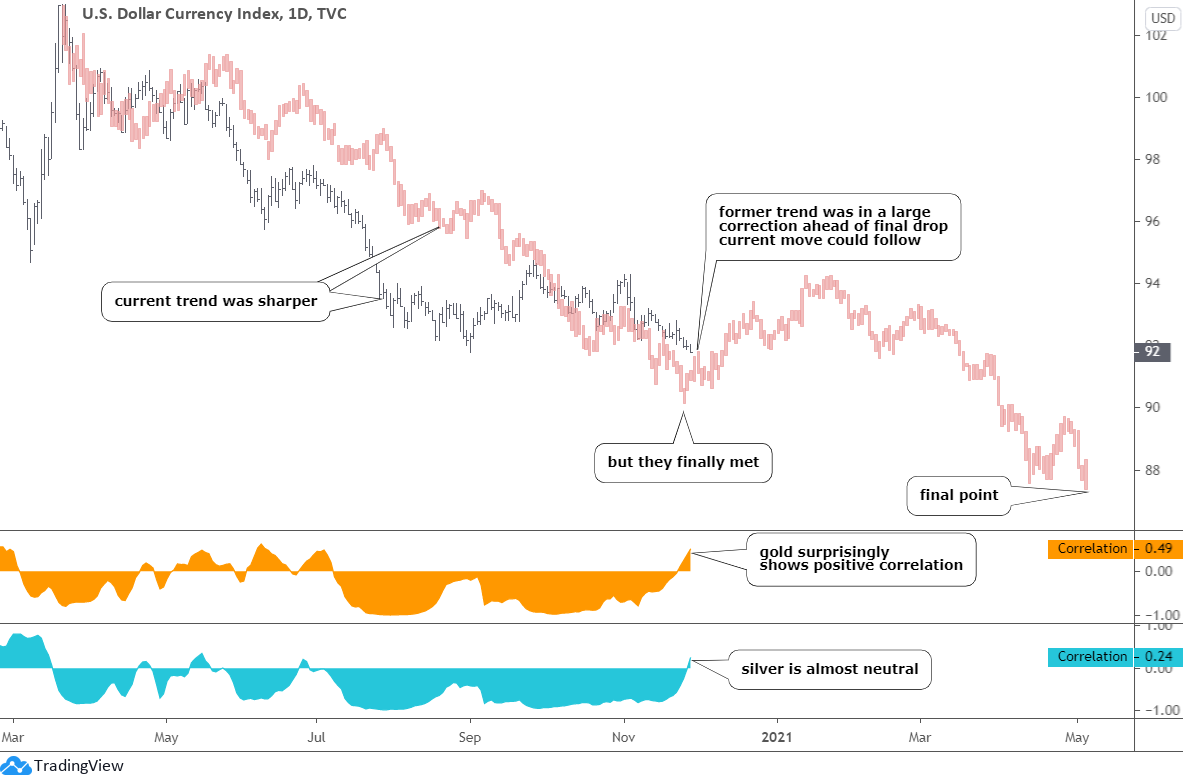
Sometimes we cannot rely on the correlation between certain instruments as they suddenly interrupt the link. I added the U.S. dollar index (DXY) chart below to illustrate it.

Silver Dollar Index

Surprisingly, gold's correlation (orange indicator sub-chart) went into a positive territory recently as it reached quite a decent number of 0.49 with an absolute correlation at 1.00.

Simultaneously, silver shows an almost neutral link, although it usually has a negative reading. All three of them dropped, but at a different speed. It indicates that the market has switched to the risk-on mode as safe havens were dumped. This time silver's dual nature showed up as it could shine when the world is a gloomy place, and when the world needs it as an industrial metal.

Now, let's look at Continue reading "Gold Is Well-Behaved, But Silver Is Not"

Gold & Silver: One More Move Down?

Old trading wisdom was the title for the previous post "Buy Rumors, Sell Facts" played out the same day it was published on the Blog. The price of gold dropped close to 6% from the top of $1966, and the pride of silver suffered even more as it fell more than 9% from the peak of $26.

The real reason behind that strong sell-off was the news that Pfizer's early data showed the COVID-19 vaccine is more than 90% effective, which brightened the outlook for the global economy and triggered the run from the safe-havens. Although my call in the previous post was based on the simple trading logic and the chart structure knowledge, it came true. Thank you for your support with helpful and prophetic votes and comments.

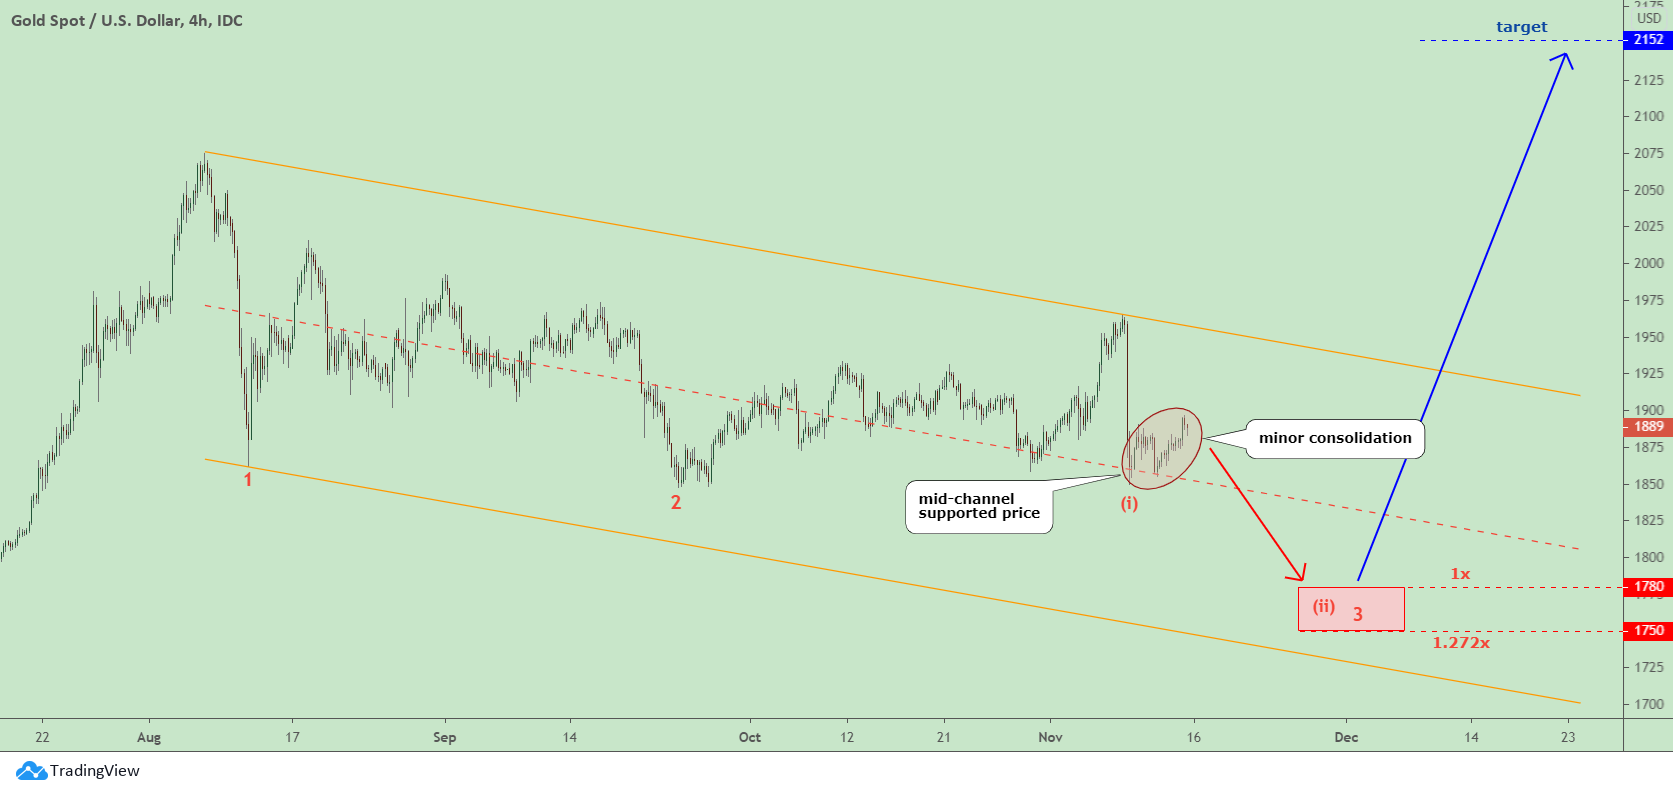
Let's get down to update; I switched to a lower time frame of 4-hour to highlight the current consolidation in more detail.

4 - Hour Gold Chart

This time gold shows a clearer structure than silver as the former broke below the counter-trend consolidation valley at $1859. This validated the current leg down then. Continue reading "Gold & Silver: One More Move Down?"

Gold & Silver: "Buy Rumors, Sell Facts"?

When there is something turbulent happening in the world, investors buy the dollar as a safe haven. However, when there is uncertainty in the United States itself, as we have been observing recently with the situation around the 2020 election, money shifts to a universal shelter to precious metals such as gold and silver.

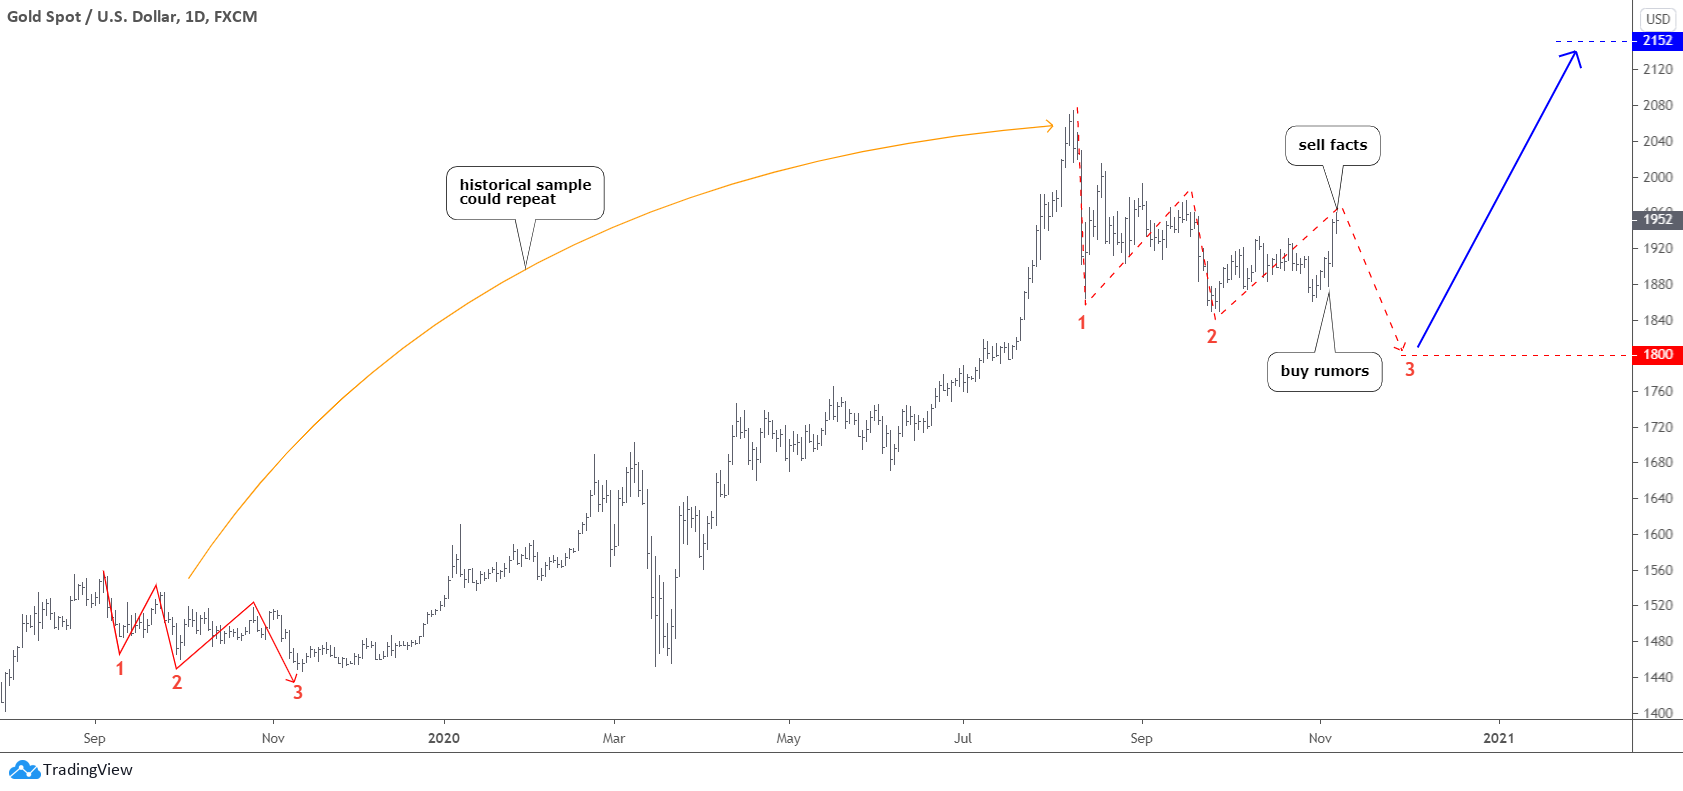
One should be careful these days, as we need to remember the old trading wisdom, which says buy rumors, sell facts. The Results of this election finally came out, catching traders out of access to the market on the weekend. This could be a good lesson to keep away during such a major event such as this US presidential election as volatility spikes dramatically as well as investors' emotions, and only a deep "pocket" could survive then.

Gold Chart

Gold was up and down with huge moves in both directions last week. It finished the period on the upbeat, as investors were puzzled with uncertainty over election results. The move-up was strong as the price quickly broke $1900 and gained $84 from $1876 to $1960 at the top. Some profit-taking then followed as the week ended lower at $1952. Continue reading "Gold & Silver: "Buy Rumors, Sell Facts"?"

The Copper/Gold Ratio Would Change The Macro

The Copper/Gold ratio is saying something. That something is that a cyclical, pro-inflation and thus pro-economic reflation metal shown earlier, remaining nominally positive on a down market day has, in relation to gold, taken out two important moving averages (daily SMA 50 & SMA 200) and is currently riding the short-term EMA 20 upward. RSI and MACD are positive.

Copper: Pro-cyclical inflation, pro-reflation, pro-economy.

Gold: Counter-cyclical, monetary, with inflationary utility.

Given the right circumstances (like desperate monetary and fiscal policy), which are in play on the wider macro, gold will probably do quite well moving forward. But maybe – for a while – not as well as some commodities if the Copper/Gold ratio really is up to something positive here.

copper/gold ratio

Side note: the Palladium/Gold ratio is on the verge of going positive as well and of course the daddy of inter-metal ratios, the Gold/Silver ratio is still on a big picture breakdown (Silver/Gold has broken above a key long-term resistance marker). So you might want to look at these three metallic indicators together (along with more traditional non-metallic inflation indicators) in gauging the process toward inflation. Continue reading "The Copper/Gold Ratio Would Change The Macro"

Chop & Grind: Gold, Stocks And Commodities

Whether the market is foreign or domestic, equity, commodity, or metal the grind is on. Speaking of grind, the one in gold has been expected as the metal builds out its big picture Handle to the bullish Cup with an objective that is much higher. Let’s take a look at a few NFTRH charts to gauge the grind in several markets and by extension, the grind many feel on their nerves these days. It’s not a time to make money. It’s a time to preserve gains and patiently position.

For gold, the grind would be the making of a Handle after the Cup’s key higher high to the 2011 high.

gold price

The daily chart below shows the form it is taking; a falling wedge toward the first support area just above 1800. If the monthly chart above is to make a substantial Handle the gold price correction could extend to a test of the rising 200-day average. RSI and MACD are negative.

Easy now, it’s not a prediction, but don’t let the perma-pompoms tell you it is not doable. Let’s keep it muted ladies. Continue reading "Chop & Grind: Gold, Stocks And Commodities"