Is The Dollar Going To Steal The Santa Claus Rally?

Top metals failed to keep on the bullish track set earlier. A heavy-duty dollar reinforced by historically high inflation, earlier tapering expectations, and a turn to safety puts pressure on precious metals.

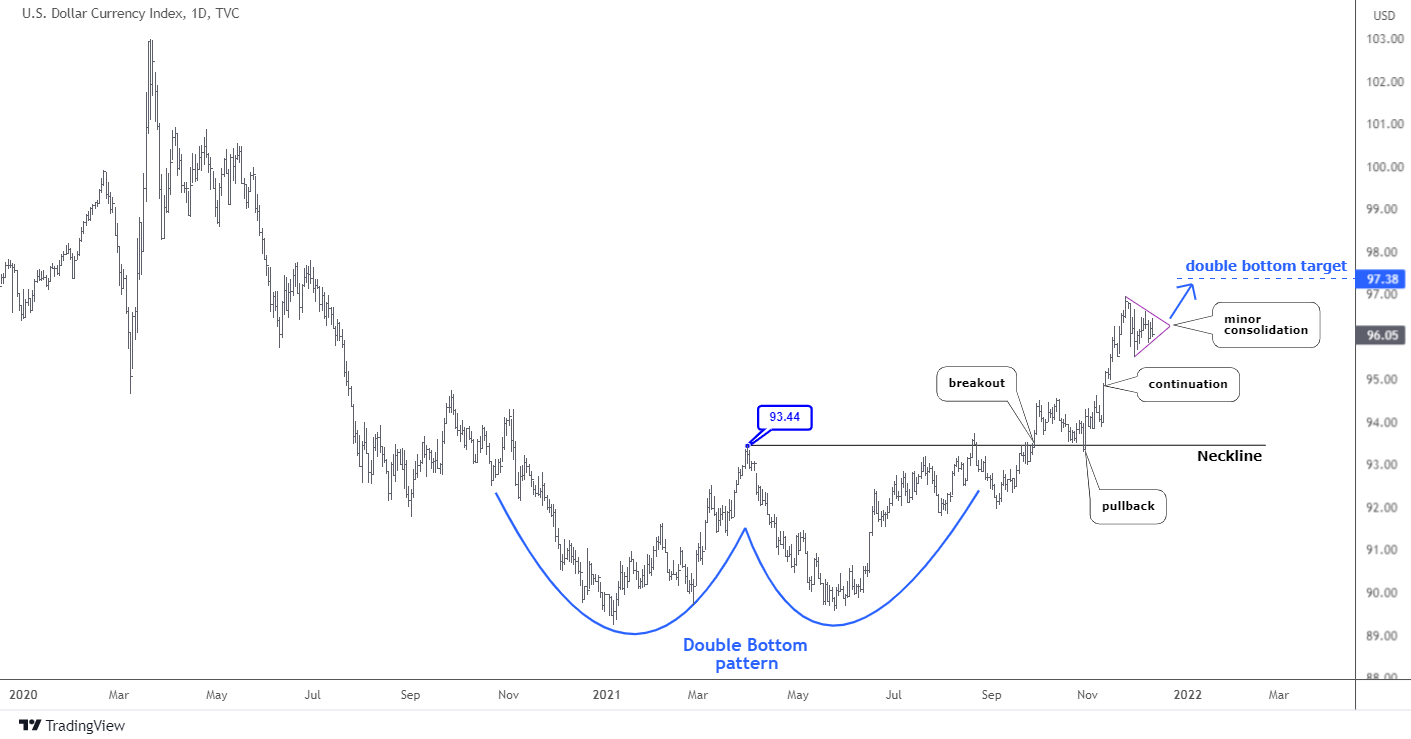
Let us see what is currently happening with the Dollar Index in the daily chart below.

Dollar

The well-known "Double Bottom" (blue) pattern has emerged in the summer. It is a textbook case as all stages went precisely as they should appear.

The focus was on the breakup of the so-called "Neckline" (black horizontal line) located at the top between the two bottoms at $93.44. The first attempt to crack that level occurred at the end of August, but it failed. After a small retracement, the second attempt at the end of September succeeded in breaking out. The impulse was so strong that the price overshot the Neckline with a big margin to hit the fresh one-year top of $94.5. Continue reading "Is The Dollar Going To Steal The Santa Claus Rally?"

Weekly Stock Market Forecast

This week we have a stock market forecast for the week of 12/12/21 from our friend Bo Yoder of the Market Forecasting Academy. Be sure to leave a comment and let us know what you think!

The S&P 500 (SPY)

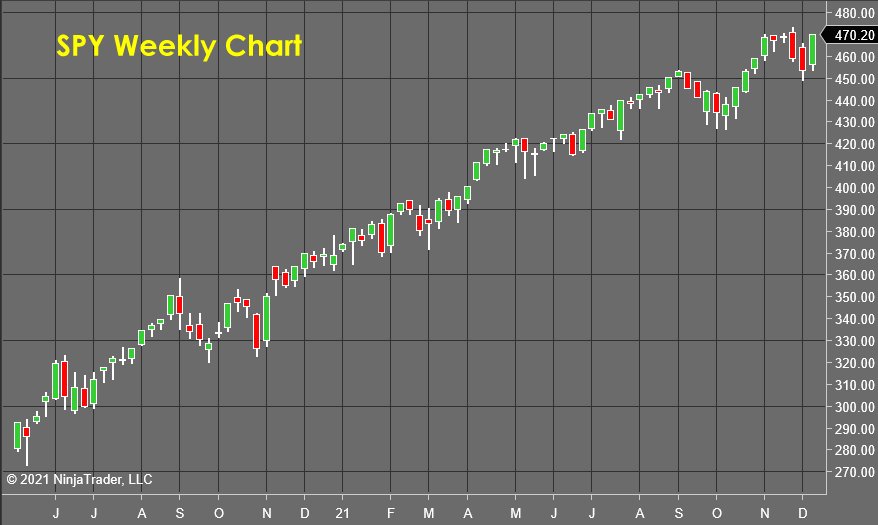
SPY Weekly Chart - Stock Market Forecast

The S&P pump started again in earnest on Tuesday and basically hasn't done anything since. If we turn lower on Monday, it would solidify the lower high I have been forecasting. We are so close to the highs that I would suspect there will be some attempt at a breakout, even if it is short-lived.

So next week will be a pivotal one; if we turn, then things should begin to accelerate to the downside. If we break out, then I'm stuck back into a holding pattern as I wait for the energy to dissipate. Continue reading "Weekly Stock Market Forecast"

Financial Sector May Rally 11% - 15% Higher

The financial sector is poised for a very strong rally into the end of 2021 and early 2022 as revenues and earnings for Q4:2021 should continue to drive an upward price trend. The US Federal Reserve is keeping interest rates low. At the same time, the US consumer continues to drive home purchases and holiday shopping. Strong economic data should drive Q4 results for the financial sector close to levels we saw in Q3:2021. If that happens, we may see a robust rally in the US Financial sector over the next 45 to 60+ days.

The strength of the recent rally in the US major indexes shows just how powerful the bullish trend bias is right now. Some traders focus on the downside risks associated with the US Federal Reserve actions and/or the concerns related to inflation and global markets. I, however, continue to focus on the strength in the US major indexes and various sector trends that show real opportunities for profits.

Comparing Sector Strength

The following two US market sector charts highlight the performance over the last 12 vs. 24 months. I want readers to pay attention to how flat the Financial Sector has stayed since just before the 2020 COVID event and how the Financial Sector has started to trend higher over the past 12 months. This is because the shock of COVID briefly disrupted consumer activity. Yet, consumers are coming back strong, driving retail sales, home sales, and the continued strong US economic data. Therefore, it makes sense that the Financial sector should continue to show firm revenue and earnings growth while the US consumer is active and spending. Continue reading "Financial Sector May Rally 11% - 15% Higher"

Gold, Silver, Gold/Silver Ratio & HUI

Precious metals are still locked down. With an understanding that there is always much more in play than nominal charts (the macro & sector fundamentals for example, which bounced of late but never did definitively flip positive), let’s review said nominal charts of gold, silver, and HUI along with an update of the Gold/Silver ratio for good measure.

Meanwhile, we will continue to update the full spectrum of considerations for a positive view of the precious metals complex, including gold’s standing vs. cyclical, risk-on markets/assets, the state of speculative vs. quality credit spreads, the inflationary backdrop (despite promotions to the contrary, cyclical inflation is not beneficial to the gold mining industry), the seasonal averages and the charts of the metals and miners over various time frames in NFTRH.

Gold

The daily chart shows the gold price (futures) below the moving averages but above short-term support after failing – amid much personally observed cheerleading to the contrary – to cross the bull gateway at 1920.

As a side note, the broken blue downtrend channel on this daily chart is actually the Handle to a large and bullish big picture Cup that only has one thing going against it that I can see; too much exposure by too many TAs, which of course means it may not be expressed until many of those TAs recant their stories (we have noted all along that the Handle can drop all the way to the 1500s without damaging the 2022 bullish Cup story. Indeed, if it were to happen (not predicting folks, but being prepared) it would be healthy. There is nothing healthier than a good running of the bugs before a major bull move. Continue reading "Gold, Silver, Gold/Silver Ratio & HUI"

Weekly Stock Market Forecast

This week we have a stock market forecast for the week of 12/5/21 from our friend Bo Yoder of the Market Forecasting Academy. Be sure to leave a comment and let us know what you think!

The S&P 500 (SPY)

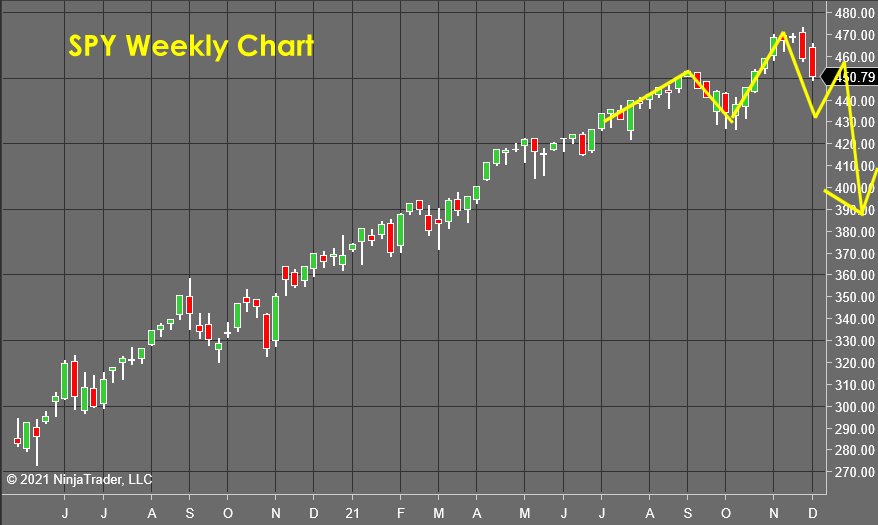
Spy Weekly Chart - Stock Market Forecast

All the waiting and watching has paid off nicely as the S&P has topped and started to trend lower in earnest. This "break" will freak some folks out, but I still believe my forecast will prove true that this selling will catch a bid and reverse the market for a short period of time. Once that momentum burns off, a lower high will form, completing a "head and shoulders" pattern, and THEN WE CRASH. Continue reading "Weekly Stock Market Forecast"