How Low Could The S&P 500 Go?

Our target for the first half of 2019 is and has been the 2100 to 2200 area for the S&P 500. A friend asked…

I’ve been meaning to ask (and possibly) know the answer, 2100-2200 for H1 2019 is your ultimate bear market target or opening act?

Opening act. It could be the ultimate target because there is a lot of support at that area and a good solid bear phase could put the Fed on ice and impose some changes to Donald Trump’s bull in a China shop policy style.

So, for now, I see no reason to make dire proclamations beyond that key support level, as so much will depend on incoming information in 2019. At this point, even 2100-2200 is not technically in the bag because the US stock market clung to last-ditch daily chart support, as per the marginally favored short-term NFTRH view. So all of we bear callers need to remember that as ugly as the charts are, support is not broken until it is… broken.

I was going to cover this in NFTRH 530‘s Opening Notes segment, but why not make it a public post and save NFTRH’s virtual ink for more immediate issues going on with the markets? Before we dial out to a couple of simple SPX charts showing the prospective downside targets, let's review the situation with a less than simple chart. Continue reading "How Low Could The S&P 500 Go?"

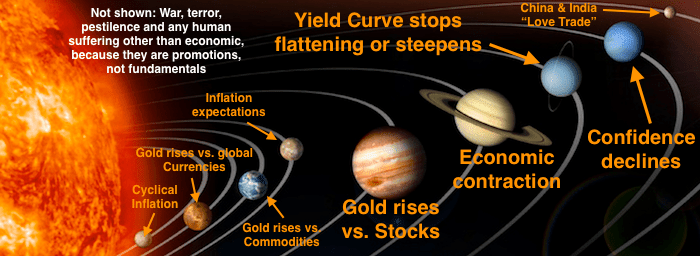
Gold Stocks Acting As They Should

The macro has moved through a time of moderately rising inflationary concerns when economies were cycling up, many commodities were firm and risk was ‘on’. Contrary to the views of inflation-oriented gold bugs, that was not the time to buy gold stocks.

As I have belabored again and again, the right time is when the inflation view is on the outs, gold is rising vs. stock markets, the economy is in question, risks of a steepening yield curve take center stage (the flattening is so mature now that steepening will be a clear and present risk moving forward) and by extension of all of those conditions, confidence declines.

Well?…

gold stock sector

In short, the improving sector and macro fundamentals I’ve been writing about for a few months now continue to slam home as the cyclical world pivots counter-cyclical. And what do you know? Gold stocks are reacting as they should. Well, it’s about time, guys!

The technicals had already made some constructive moves as noted in an NFTRH subscriber update on December 4th. The update concluded as follows… Continue reading "Gold Stocks Acting As They Should"

"Harbinger Of Doom": Amigo 3 In Play, But Real Doom Awaits

“The Harbinger of Doom”? Of course, we (well, the media) are talking about the yield curve AKA Amigo #3 of our 3 happy-go-lucky riders of the macro. I have annoyed you repeatedly with this imagery in order to show that three important macro factors needed to finish riding before a situation turns decidedly negative.

Amigo 1: SPX (or stocks in general)/Gold Ratio

Amigo 2: 30 Year Treasury Yield

Amigo 3: Yield Curve

In honor of Amigo 3’s arrival to prime time let’s have a good old fashioned Amigos update (going in reverse order) and see if we can annoy a few more people along the way.

yield curve

Yield Curve

Clicking the headline yields a Bloomberg article all about various yield curves and all the doomed news  you can use, including a hyperactive interview with an expert bringing us all up to speed on the situation. Continue reading ""Harbinger Of Doom": Amigo 3 In Play, But Real Doom Awaits"

A Post-Powell View Of USD, S&P 500 And Gold

The Fed blinked. This was not news to Macro Tourist Kevin Muir or readers of Biiwii.com, which is very pleased to publish his work.

Fed Finally Blinks

Amid a weakening global economy, gathering signs of weakening in the US economy and a dump in inflation expectations, Jerome Powell implied that the Fed may be going on hold for a while after a December rate hike.

This graph from SG Cross Asset Research/Equity Quant by way of Kevin Muir’s article attempts to show that the accumulated rate hike tightening and “shadow” tightening as a result of QE suspension has now met or exceeded the levels that preceded the last two economic recessions.

Jerome Powell

Add in very high profile haranguing by Donald Trump, the above-noted drop in inflation expectations and economic weakening (that began with our Semi sector signals nearly a year ago) and it sure is not surprising that the Fed may take its foot off the break for a while, and possibly a long while.

So what is expected of our two main themes, the cyclical and risk ‘on’ stock market and the counter-cyclical and risk ‘off’ gold and the miners, which leverage gold’s counter-cyclical utility? Let’s check in after this week’s events. Continue reading "A Post-Powell View Of USD, S&P 500 And Gold"

Slowly We Turn... Gold Vs.

Let’s take an in-day snapshot of gold vs. several key competitors (for your investment dollars/euros/yen, etc.) and check the progress in turning the macro from risk ‘on’ to risk ‘off’, cyclical to counter-cyclical.

Gold/Commodities motors along above the SMA 200. The move has been hysterical, and thus looks impulsive. That could mean something as we look back in hindsight one day.

gld.dbc

Gold/Oil has been the driver of the above. Continue reading "Slowly We Turn... Gold Vs."