Bitcoin, Ethereum, And Ripple

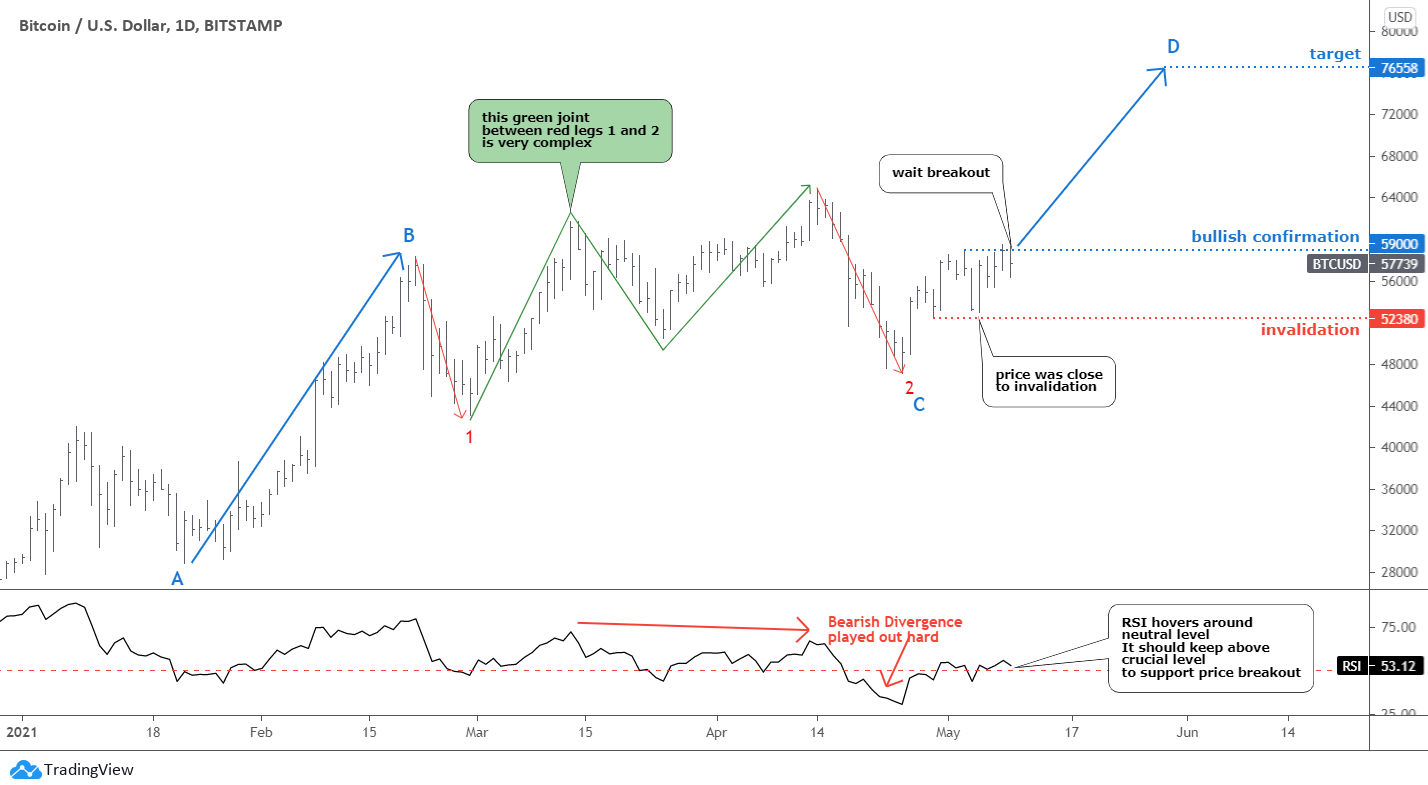
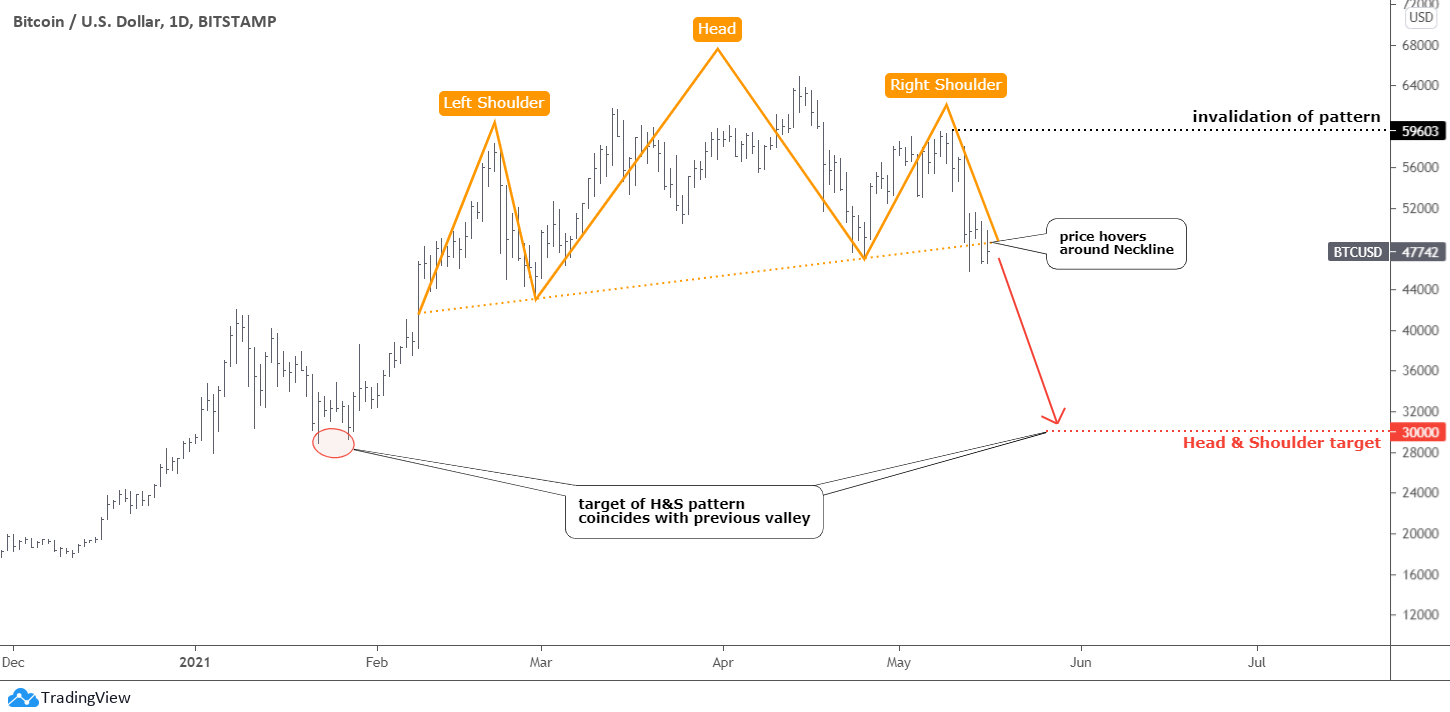
The bullish setup for Bitcoin that I discussed last week was not triggered, as the price did not break above the bullish confirmation level. The price went the opposite direction, falling beneath the invalidation trigger instead.

The key factors for the sell-off were the U.S. probe into the Binance crypto-exchange, and Tesla is reversing its stance on accepting Bitcoin. The green economy does not support Bitcoin due to its vast electricity consumption, which is generated primarily from fossil fuels.

Bitcoin Daily Chart

The combination of peaks in one area with the highest one in between has built the famous Head & Shoulders reversal pattern (orange). The main focus now is on the orange dotted Neckline as the price hovers around that support. A clear breakdown of it is needed for the pattern to play out. Continue reading "Bitcoin, Ethereum, And Ripple"

Bitcoin: Make It Or Break It

One of our readers requested the update on cryptos, including Ethereum, this week. Here we go.

The leading coin has taught us excellent lessons recently. I shared with you a bullish setup for Bitcoin a month ago. In the following update, I recommended to move the stop loss higher from $50k to $55k area to cut the risk after the breakout and increase the risk/reward ratio to sound 2.7.

The price indeed broke above the confirmation level of $61782 and quickly reached the new all-time high in the $65k area, but then it failed to advance.

Bitcoin

We have the first lesson here from the RSI. As we can see on the sub-chart, the indicator did not confirm the new all-time high as it established a lower peak instead. This built the Bearish Divergence then, and the outcome you already know, the price collapsed dramatically. Continue reading "Bitcoin: Make It Or Break It"

Dollar, Gold And Silver: The Market Takes A Break

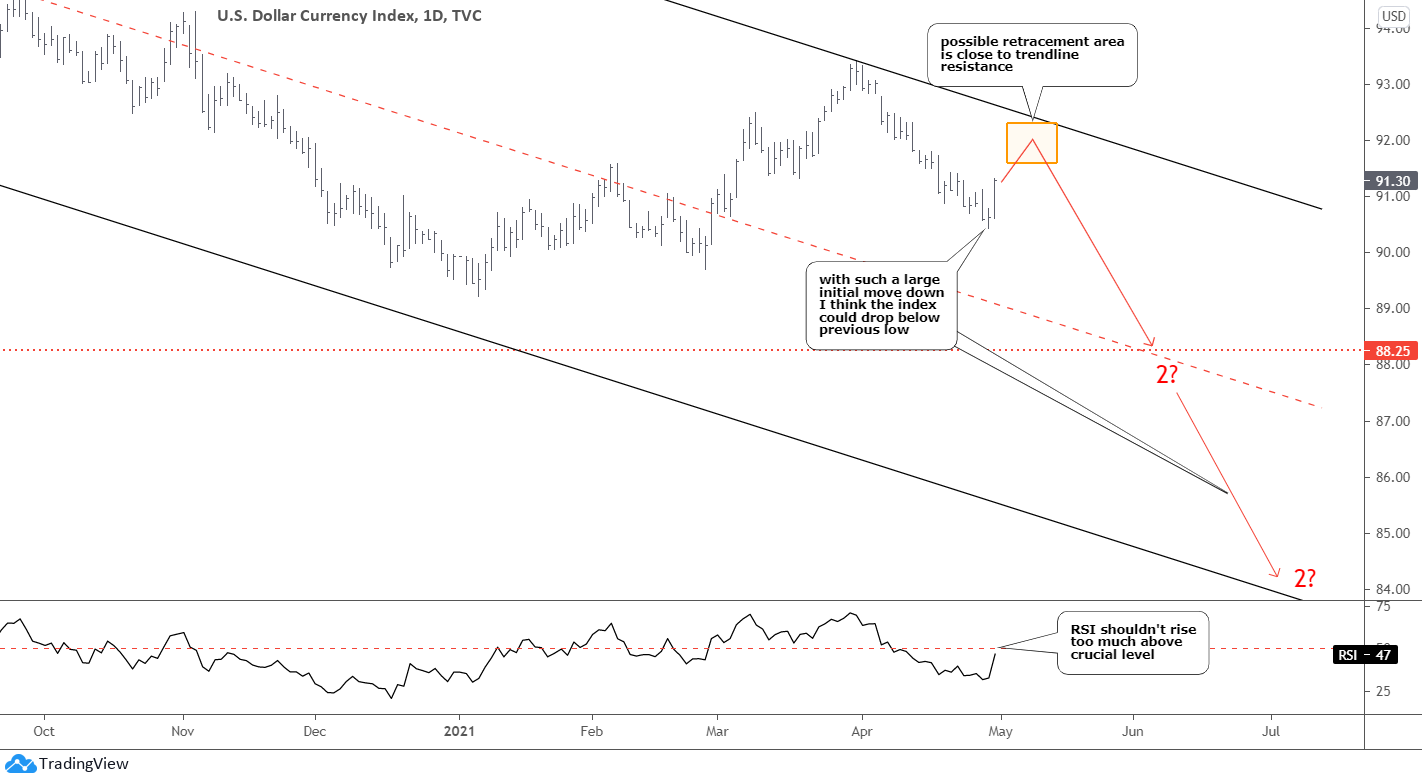
The market does not move in a straight line. I anticipated a correction to start in the U.S. dollar index (DXY) as it moved down too far without a break, and it came at the end of last week. Traders decided to book some profit ahead of a weekend, pushing the price of the dollar higher.

U.S. Dollar Index Daily Chart

I highlighted the possible retracement area between 38.2% and 61.8% Fibonacci levels with the orange rectangle within the 91.60 - 92.30 range. The dollar nears the first resistance. The top of the rectangle is very close to the trendline resistance, making it a fortified barrier. Continue reading "Dollar, Gold And Silver: The Market Takes A Break"

Gold & Silver: The Dollar Shows The Way

The U.S. dollar index (DXY), aka “King,” has a clear structure in its chart as it moves accurately according to the plan posted at the beginning of the month. Most of you supported the idea that the dollar will show another drop.

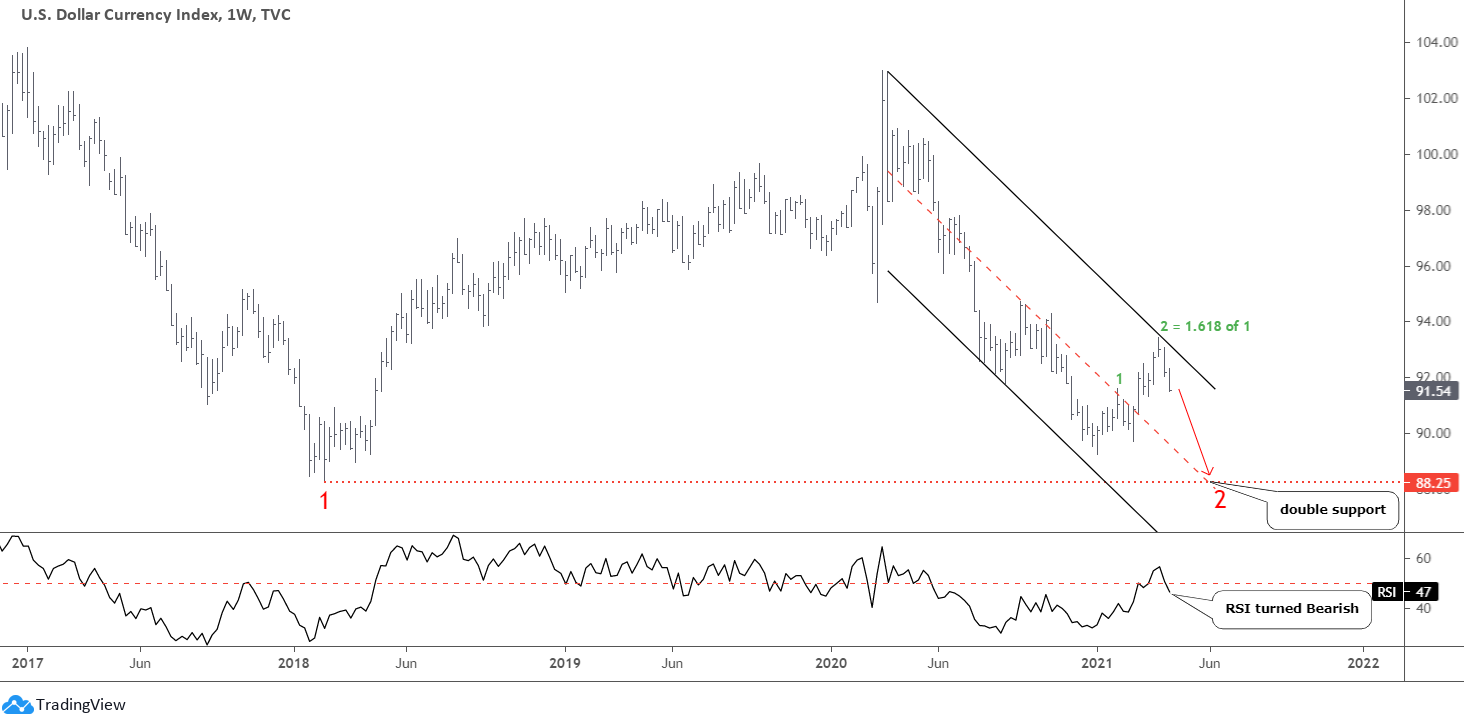
King Dollar Weekly Chart

The green leg 2 of the pullback traveled 1.618 of the distance of the first green leg up and touched 93.44 at the top. Then, the price quickly reversed down to drop like a rock. The last week’s bar closed at the minimum as selling pressure persisted. I switched to a weekly time frame to show you how accurately the current second leg down repeats the path of the first leg down.

This time, after the price went deep down, I built the black downtrend channel through the recent peak. We can see the magic of the trend here as the mid-channel accurately intersects the valley of the first leg down at 88.25 to offer double support for the price.

The RSI turned Bearish following the brief roll over the crucial level. It confirms the downward outlook.

This predictability of the dollar dynamics made me reconsider the gold chart below. Continue reading "Gold & Silver: The Dollar Shows The Way"

Bitcoin Nears Trigger, AAPL Set To Rally

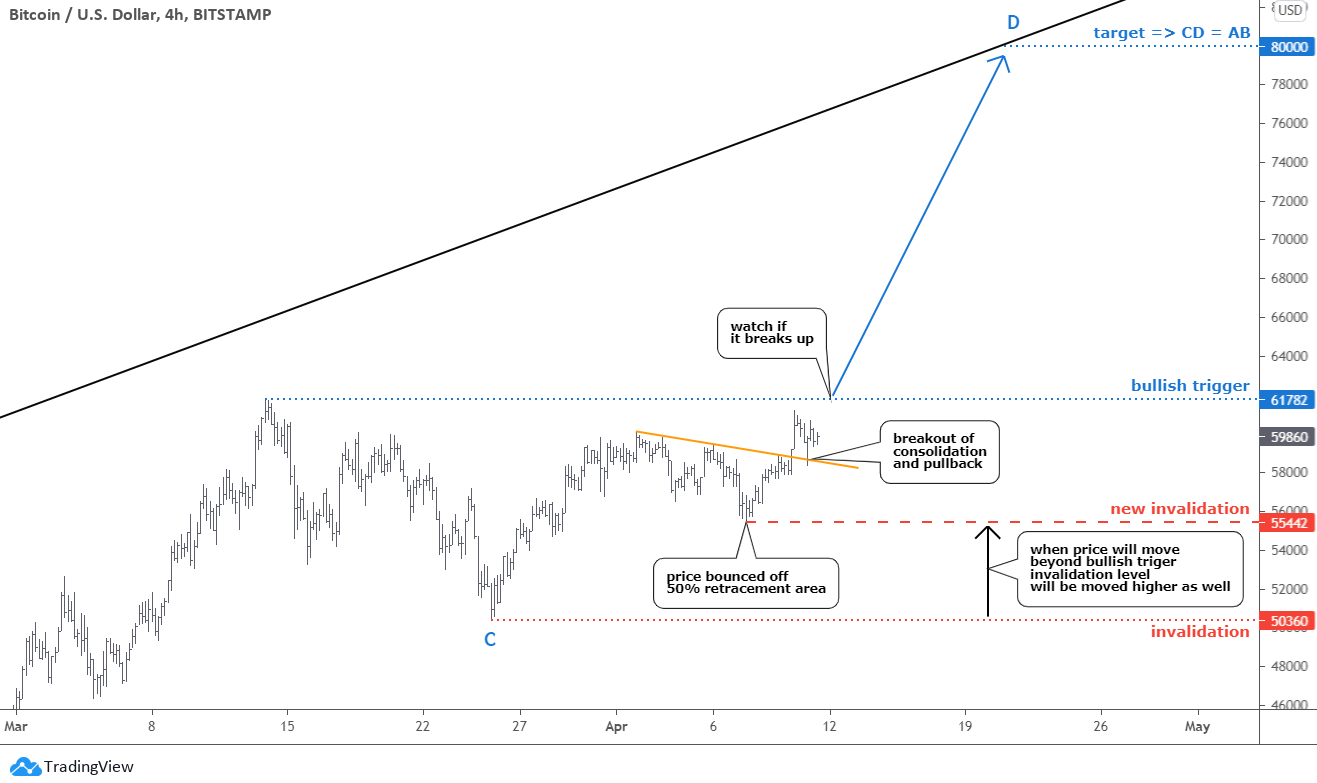
A sleepless Bitcoin moves accurately as per the plan posted last week. The majority of you agreed that the $80k target is achievable for the leading coin. Here is an updated chart below where I zoomed in to a 4-hour time frame to share more details with you.

Bitcoin Price Chart

As I said before, Bitcoin's chart structure builds similarly with conventional trading instruments these days. The forecasted correction reached the 50% Fibonacci retracement level in the $55k area. It stopped there as the price bounced up and hit the orange trendline resistance soon. Continue reading "Bitcoin Nears Trigger, AAPL Set To Rally"