Bitcoin Triggered Buy Setup, Plus Gold And Silver

Bitcoin is a true modern hero in the financial world as it stands no matter what. Let it be the Chinese government's ban or US regulators and financial elite's rejection.

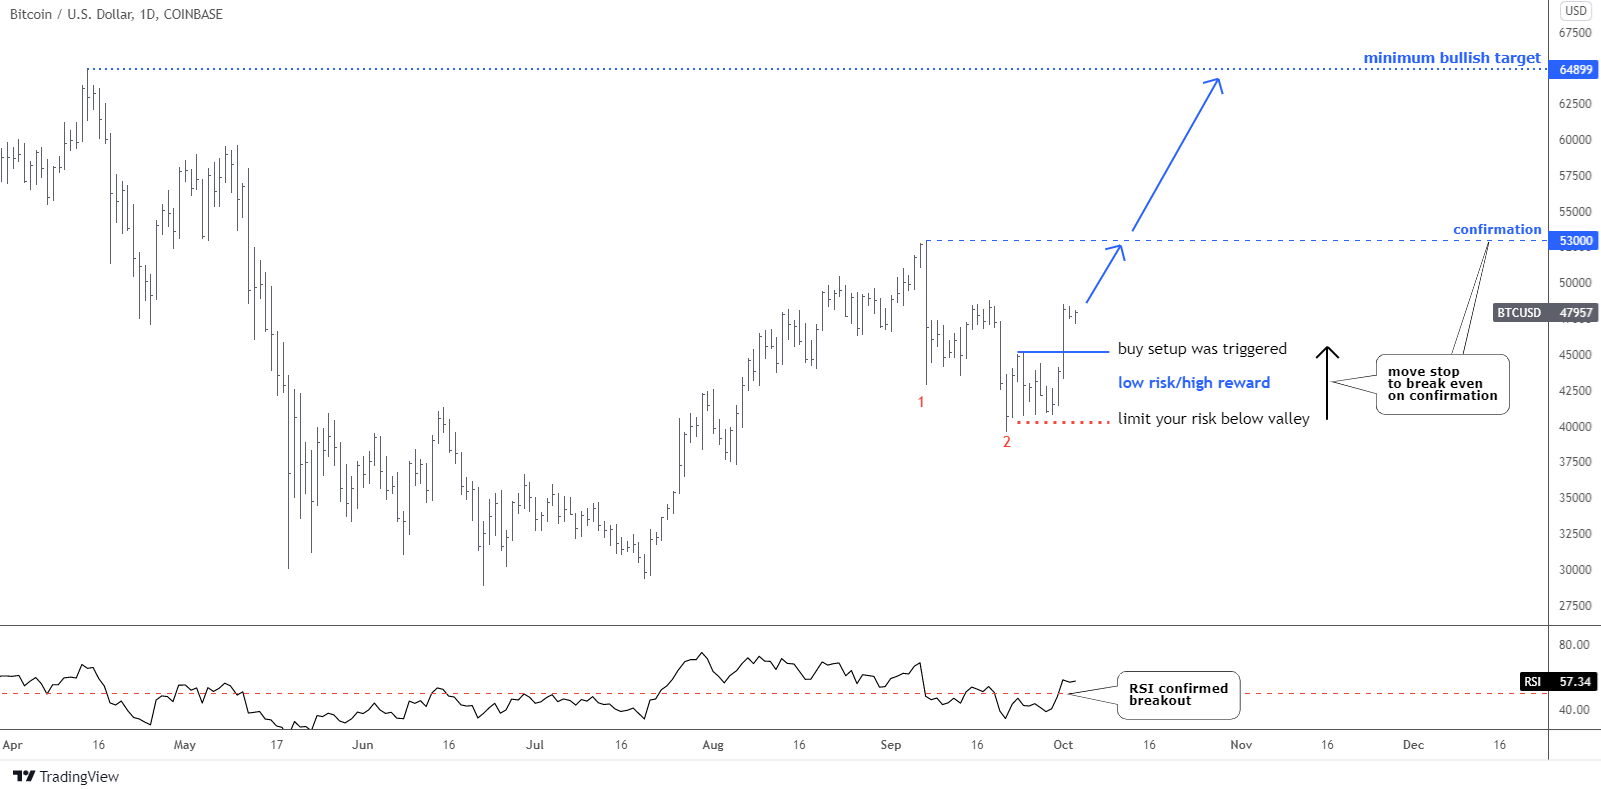
It is amazing how Bitcoin follows a conventional chart structure as it acts like matured instruments over time but at a higher speed. The predicted drop in leg 2 down hasn’t kept us long as it emerged the same day when the previous update was posted.

Most of you thought that this drop could be just a part of a pullback ahead of another Bitcoin rally.

Bitcoin Daily Chart

The collapse in red leg 2 down was close to hitting the preset target of $38k, as it bottomed at the $39,600 mark. The structure looks completed as it has met the minimum requirement to travel an equal distance with leg 1. Continue reading "Bitcoin Triggered Buy Setup, Plus Gold And Silver"

Gold Builds Buy Setup, Is Bitcoin Next?

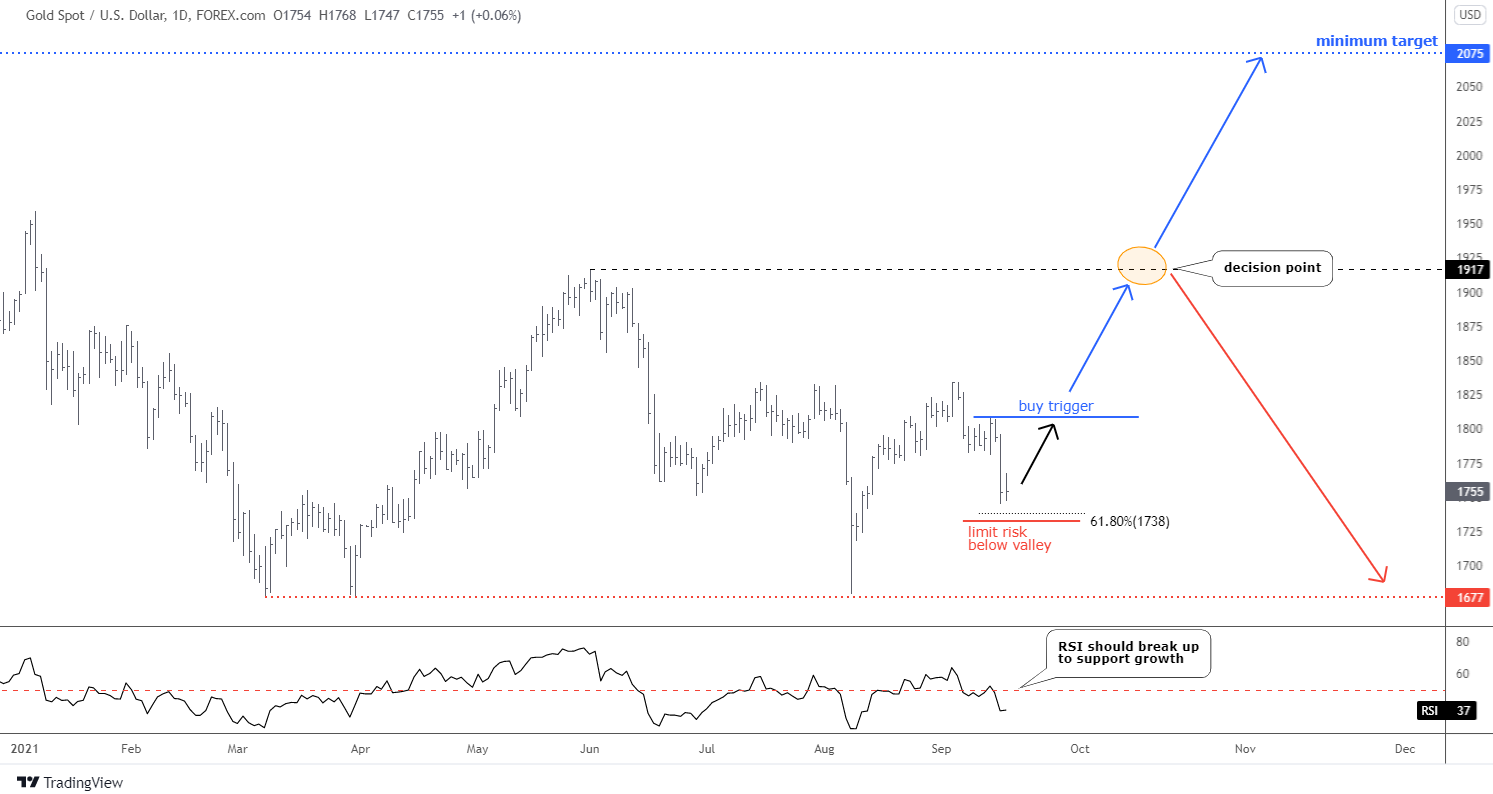
Gold follows the map posted in an earlier update.

Daily Gold Chart

Gold dropped within two visible legs close to the area of 61.8% Fibonacci retracement level located at $1,738. The second leg down has overshot the size of the first leg reaching almost 1.272 of its distance. The RSI has shown two legs down either. Initially, the 50 level in the indicator’s sub-chart acted as a support, and then it turned resistance for the joint between two legs. Continue reading "Gold Builds Buy Setup, Is Bitcoin Next?"

S&P 500 To Lose 30%?

It is not clickbait for hype. I will take you through my observations in this post to show you why it could play out.

Every market has its stages develop over time: Boom and Bust, Growth and Correction, Collapse and Consolidation. The corrective phase could be around for the stock market.

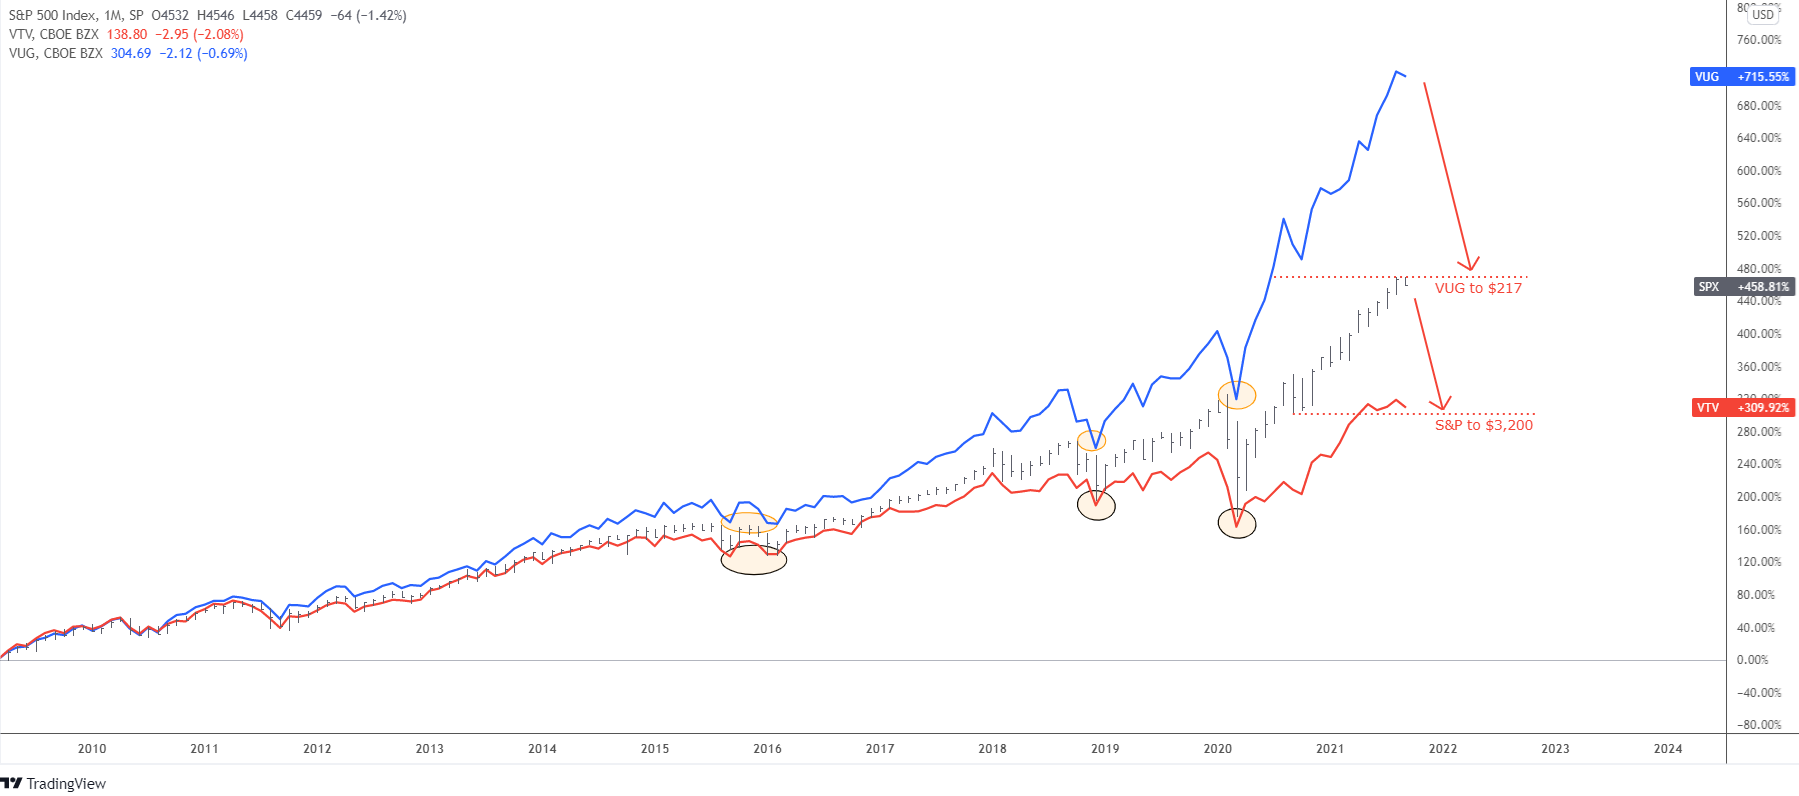
The main question, as always, is how deep it could drop when a retracement unfolds. This is not an easy one. To see the market from different angles, I built the comparison chart as I put the S&P 500 index itself (black bars), then I added Vanguard Value Index Fund ETF (VTV) (red line) and Vanguard Growth Index Fund ETF (VUG) (blue line).

S&P 500

This monthly chart starts from the major bottom in 2009. SINCE THEN, the S&P 500 index has gained more than 450% since then, the value stocks have scored more than 300%, while the growth stocks have made a jaw-dropping 715%. Continue reading "S&P 500 To Lose 30%?"

Watch Ethereum As Bitcoin Loses Momentum

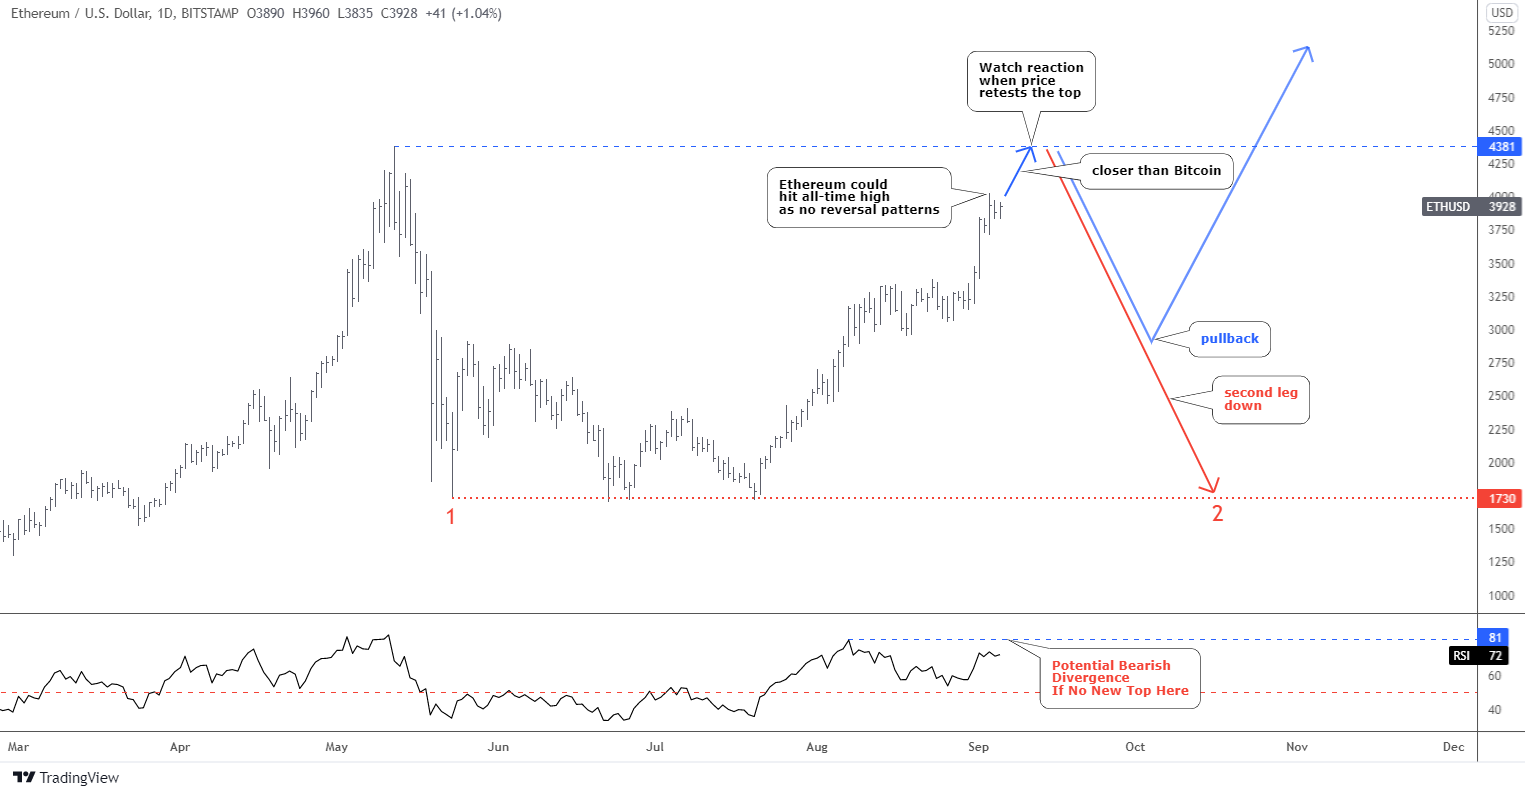
You hit it right when you bet that Ethereum would go higher this July as I called for a complex correction to limit the growth of this cryptocurrency around $3k.

Ethereum

The price hit that upside barrier and stopped there for a while within a visible sideways consolidation. After that, it broke to the upside, as the pause was a harbinger of the uptrend’s continuation. The price quickly hit the $4k handle, and now we could observe a minor consolidation. Continue reading "Watch Ethereum As Bitcoin Loses Momentum"

Bitcoin and Gold Update: What's Next?

Bitcoin triggered the new buy setup posted last week.

Most readers confirmed that they see the new bullish opportunity in Bitcoin, and the largest part were ready to add or enter the new trade.

Bitcoin Daily Chart

The new buy setup repeated the first trade setup as the setback was not deep again as it only reached the same 38.2% Fibonacci retracement level.

The Friday brought the expected trigger above the previous Saturday’s top of $48,150. The setup is active now and should limit risk below the valley of correction to around $43,900. The risk/reward is good at 1:4, with the same target at the all-time high of $64,899. Continue reading "Bitcoin and Gold Update: What's Next?"