10-Year U.S. Treasury Note Yield Eyes 3.33%

Last week I promised to update the outlook for the U.S. interest rate, which has a strong impact on every asset class including precious metals.

More than a year ago I shared with you my concerns about the future of gold once the “era of rising rates” would come. The 10-year U.S. Treasury note yield (10Y) was at 2.2%, and large investment banks forecasted 3% yield for the near future at that time.

Indeed, that future has come in one year the 10Y is above the 3% now, and it doesn’t look like it’s the final stop. To see what could be the next I’ll share with you two charts starting from a short-term view.

Chart 1. 10Y Weekly: 3.33% And More
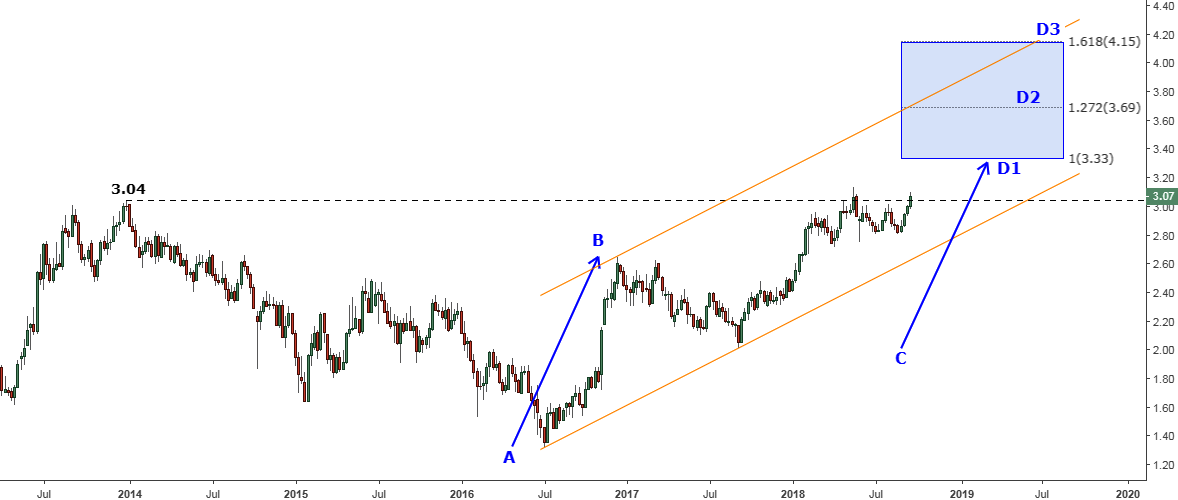
10-Year U.S. Treasury Note Yield
Chart courtesy of tradingview.com

This chart above observes the past five years to envelop the earlier top of 3.04%, which is under a second attack as the first one this past May couldn’t peg it. The yield closed last week at the 3.07%, and this time it could finally overcome the barrier to reach the target.
Continue reading "10-Year U.S. Treasury Note Yield Eyes 3.33%"

Gold Struggles While Silver Doesn't

In this post, I will take a deep dive into the chart structure of the precious metals as prices approach crucial triggers but on the opposite sides of each metal.

Let’s start with gold as it struggles to gain a foothold above $1200.

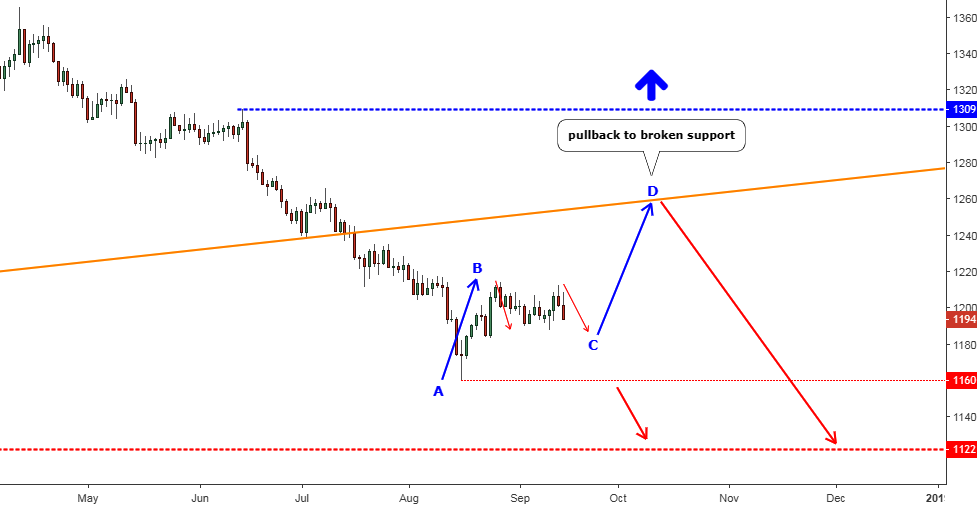
Chart 1. Gold Daily: Pullback

Gold Struggles
Chart courtesy of tradingview.com

The votes were split almost evenly in the poll in my earlier post about the gold’s outlook. Half of the readers chose the trigger of the upside resistance at the $1218 and the rest thought that the market would drop to retest the $1122. The metal price then was just a little bit lower than these days at the $1186.

Almost one month has passed since then, and to my surprise, none of the triggers were pulled although we were very close to the $1218 point, the market couldn’t push above the $1214 at the end of the August and then retreated below $1200. This month we could see the increasing activity as investors are back from their summer holidays. There was another attempt to clear the resistance last week, but it stalled at the $1213 and the significant level again remained untouched. Continue reading "Gold Struggles While Silver Doesn't"

Chip Maker Hits Target, Beats Rivals and Bitcoin

Last November I shared a promising trading opportunity to play on the Modern “Gold Rush” For Cryptocoins. Like the Great Gold Rush, I thought that those who sell equipment could benefit from new a “tulip mania” as this crypto buzz was called in the media.

I selected three chip makers, which were well known for the broad use of their products in the “mining” of cryptocoins. These companies are NVIDIA Corporation (NVDA), Advanced Micro Devices, Inc (AMD) and Taiwan Semiconductor Manufacturing Company, Limited (TSM). Firstly, I made the same comparative chart analysis of their stocks as I usually do for the classic mining stocks; it is funny that the word “mining” I used here has a totally different meaning.

We were on the right path as despite the market euphoria there was one stock, which lagged behind the others and the gap was significant. The laggard Advanced Micro Devices (AMD). It was the only one, which showed the negative price dynamics for the first ten months of 2017 with a -2.71% loss compared to +104.58% for NVDA, +43.94% for TSM and +14.62% for S&P 500. Continue reading "Chip Maker Hits Target, Beats Rivals and Bitcoin"

Gold & Silver: Hard Ground or Quicksand?

I know that most of the readers don’t like when I post bearish outlooks for the top metals as even if there are dozens of downloads, still nobody pushes the “like” button. It could be a fascinating research subject for behavioral finance or at least an excellent contrarian indicator.

Frankly speaking, I keep an unbiased stance and share my view of the structures that develop in the market. I just read signals that the market sends us all the time. From the start of the year, there are totally bearish outlooks were posted as we had strong signs in the charts and we can see that they proved to be right and one could make good money.

In this post I would like to address the question that arises these days, is this recent bounce a reversal or just another correction?

Let’s start with gold.

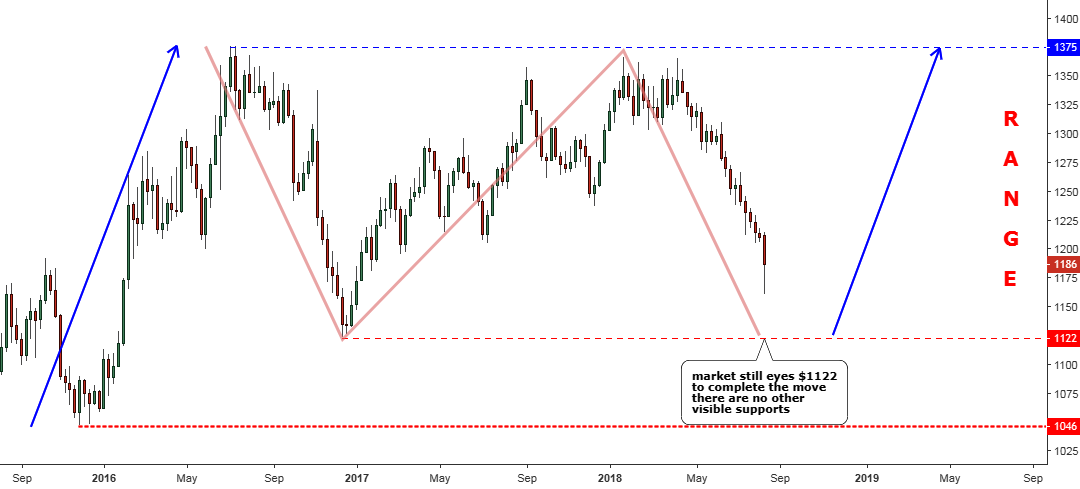
Gold Weekly Chart: Market Eyes $1122 To Complete The Structure

Gold Weekly Chart
Chart courtesy of tradingview.com

Before we start I recommend that you check out this earlier gold chart to see the price and triggers’ position before the drop and signals, which I outlined in that post to refresh your memory as more than six months passed. Continue reading "Gold & Silver: Hard Ground or Quicksand?"

Copper To Retest $1.94 After Breaking Support

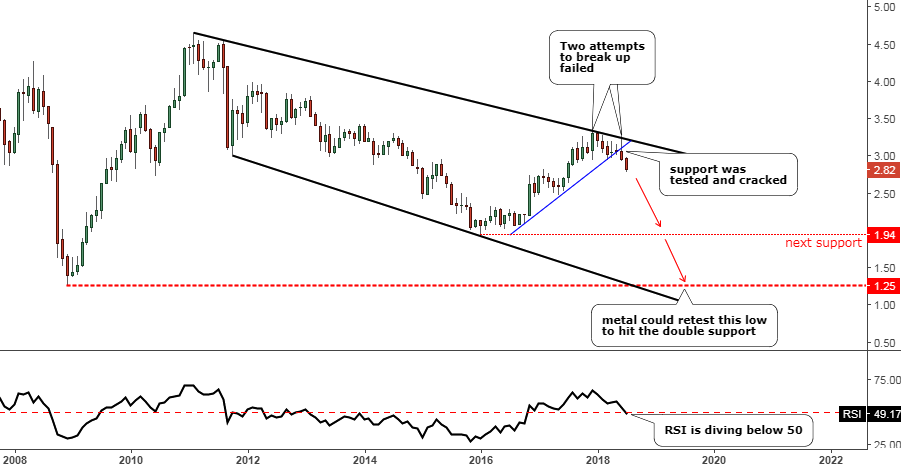
Last September I posted a monthly chart of Copper futures to warn you that the metal has been approaching the area of strong multi-year resistance. In that very same post, I set specific triggers to watch for further price action.

Recently, one of those triggers was broken, and now it’s time to update the chart.

Chart. Copper Futures Monthly: Crucial Support Was Broken

Copper
Chart courtesy of tradingview.com

The global chart structure hasn’t changed, and I posted its full reconstruction adding some new annotations to highlight the most recent price action. Continue reading "Copper To Retest $1.94 After Breaking Support"