Palladium Reached Double Resistance

Back in March, I shared with you an updated chart for palladium. It hit the record high of $1553 by that time to become the most precious metal, and it still is.

Every time the price makes a record high, there is a chance for a reversal. In that post, I measured the AB/CD segments of the upside moves on the chart and both short term and long term measurements showed the equality, which meant the possible exhaustion of a Bull Run. I didn't try to guess the top that time and asked your opinion. Below is the distribution of your votes.

Palladium

Most voters chose the $1600-2000 range for the top of the palladium price, which meant that the established new record should be updated to the upside. Your prediction amazingly came true, but this bet wasn't that obvious as it played out only five months later, when the metal refreshed the all-time high at $1601 in July as only then the price entered the forecasted range. Last week the price did it once again to hit a new record high of $1750, confirming your accurate prophecy. Congratulations!

Let's see what happens with the palladium futures these days in the weekly chart below. Continue reading "Palladium Reached Double Resistance"

Gold Update: $1616?

Last month, after gold had missed our primary target of $1577 and then started to collapse, I wondered if "A Bear Face Was Showing Up?". The price was still above the trendline support, although it dipped below $1500. I also spotted the potential reversal Head & Shoulders pattern, which was adding to the possible Bear Face.

Let's see below what you had been expecting from the market these days.

Gold

The most of your votes in the earlier ballot were for the "No" option, which means you didn't think that gold had topped already keeping bullish outlook, no matter what. The thing is that we don't know the right answer yet, as none of the triggers were pushed. To remind you, the Bearish confirmation is only below $1400, and the Bullish one is above $1557.

I want to share with you the anatomy of the failed Head & Shoulders pattern below to show what has gone wrong for educational purposes in the 4-hour chart below. Continue reading "Gold Update: $1616?"

Silver Update: This Setback Could Be A Takeoff Roll

Earlier this August, I shared with you the map for silver with three possible options of how the price could emerge. I labeled them with three different colors for you to distinguish them easily.

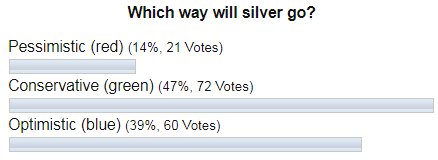
Let’s see below how did you vote for the future of the silver price.

Silver Poll

I didn’t doubt that the “Pessimistic” (red) scenario would be the least liked option as silver bears are rare these days amid the powerful bullish move in the metal’s price, that had preceded the ballot. The polar “Optimistic” (blue) scenario, which implied the non-stop move of the silver price to the upside to tag the former top of $21.13, ranked second. Indeed, it was a close call as the poor man's gold, surprisingly rocketed in a week after the post to hit the multi-year maximum at the $19.65. It could be a winning stake, but right after that the price dropped hard to close the first week of September below $18. And here comes the accurate prediction, that was picked by the majority as you had chosen the “Conservative” (green) scenario, which implied the setback of the price ahead of the final home run. Again, it was an amazingly prophetic call, thanks for sharing your votes with all of us here on the Blog.

I updated the map for you in the weekly silver chart below, let’s have a look there. Continue reading "Silver Update: This Setback Could Be A Takeoff Roll"

Bitcoin Dropped To The Target

Many years ago, when I was fifteen, I was inspired to become a professional trader after I had read a magazine story about a so-called “whale, the large market player. He was moving the markets with large orders sent to his broker out of his luxury hotel room. Markets were panicking, and politicians were trying to soothe the public telling them “true” stories. But the truth is that the impulse of the price was generated first in the “whale’s” mind and then it reached the market through the skillful hands of his broker, no other reason, except his will. The concept behind his action is a real mystery, known solely by himself. He could use any kind of analysis to be successful. The remaining is just the “noise.”

We are not “whales,” and I am not fifteen anymore, but we can find market irregularities to turn it into a profit. Let politicians talk, media buzz and profit run.

The bitcoin structure has been developing prophetically accurate as per the plan, that I shared with you a month ago. The leading coin has dropped hard from what looked to be an unbreakable area at $10,000 to hit the most anticipated target of $7,800. The actual low was just a few dollars below it. Again, the majority of you have made the correct choice based on the chart structure I highlighted for you. Hopefully, our vision gets sharper over time.

This collapse extended the damage of the crypto to 43% from the top of $13,764 established in June. The media have naturally started the “noise,” but we were prepared for this move two months ago, and we are not going to buy their “truth” as they usually sell extremes of either doomsday or a tulip mania. None of this is going to happen soon. Some “whales” just pushed down the market reckoning old trading wisdom – “if they don’t buy then I sell.” That’s it. This is what I was telling you at the opening of this post. Continue reading "Bitcoin Dropped To The Target"

Copper Update: Compressed Spring Could Snap Back Hard

I’ve had a bearish outlook for copper for the past 2 years, starting with my post back in September 2017 when I had doubted the metal’s ability to sustain a long-term rally. Last July, we got the final confirmation of the trend reversal to the downside. And this past February I shared with you a promising trading opportunity, which had appeared in the copper market as the short-term upward correction invited the bears to sell the copper again around $3.

Indeed, copper has plummeted since then reaching the $2.48 low at the start of this month, but the following rapid bounce into the $2.70 area signaled a possible reversal ahead.

Let’s check the charts below to see if we can find some clues behind this worrisome price action.

I start with the weekly chart as I spotted a bullish pattern there already.

Weekly Cooper Chart
Chart courtesy of tradingview.com

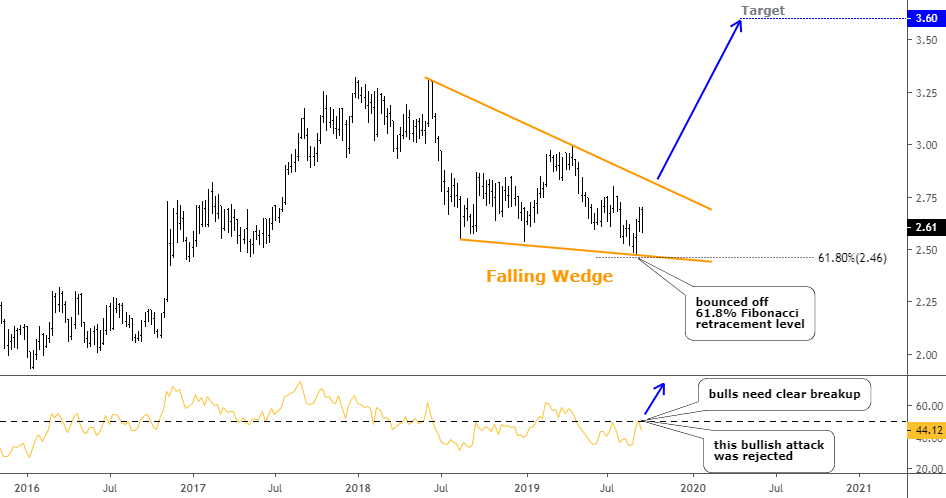
As I said above the price printed the low of $2.48 and quickly reversed then. I added the Fibonacci retracement level of 61.8% to the chart, and you can see now that the price bounced right off it. In my February post, I applied AB/CD segments to set the target area for an anticipated drop and even used the extension ratio, where the CD is even larger than the AB segment. Continue reading "Copper Update: Compressed Spring Could Snap Back Hard"