Gold & Silver: Santa Claus Rally Postponed

Both metals missed the time targets, which were set on the 13th of December for gold and on the 20th of December for silver in the previous post as I was expecting the Last Drop Ahead Of Santa Claus Rally.

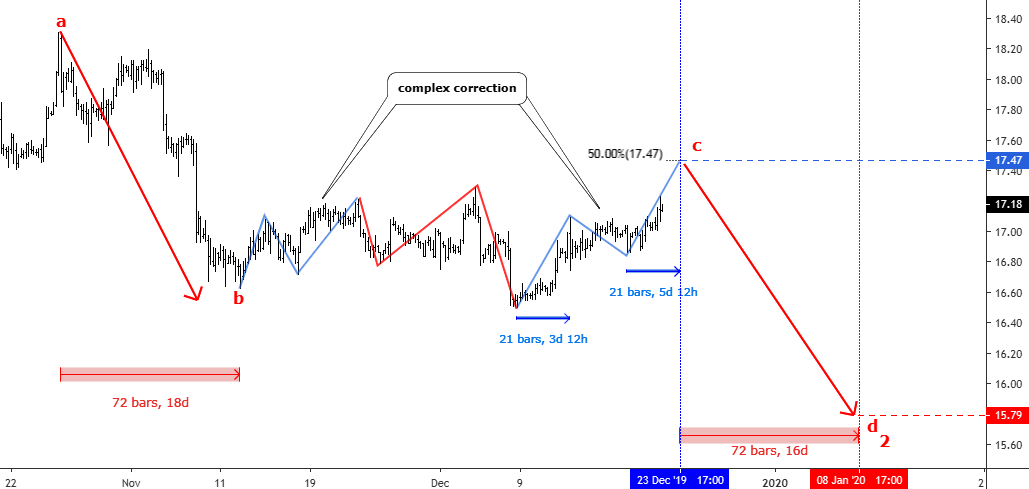
I updated the charts below and went deep into the anatomy of the current consolidation in the "bc” segment to show you in detail what holds the price for so long delaying the last drop. For that reason, I switched to a lower time frame of 4-hour.

Let me start with the silver chart as it has a less complicated structure than gold, and I will use it as a navigator.

Chart 1. Silver 4-hour
Silver
Chart courtesy of tradingview.com

Corrective structures are tricky as I always repeat it as a mantra, but it really has such a nature as it reflects the uncertainty in the market mixed with attempts of different market forces to break out of the current status quo. This creates sharp zigzags and false breakouts as we see it on the silver chart above. Continue reading "Gold & Silver: Santa Claus Rally Postponed"

Gold & Silver: Last Drop Ahead Of Santa Claus Rally?

Both metals went amazingly well with the plan that I shared with you a month ago. I have shown you a possible structure of more complex correction and set the time targets for both metals. Below you can see where you thought the completion of the corrective move would finish.

gold silver poll

The votes were split almost even with a little margin in favor of the gold bugs as they preferred January 2020 as the ending point for the current extended correction. Silver fans chose Christmas day as their metal's chart showed it as a result of calculations.

Later on, there was an update where I set the price targets for both gold, and silver for the upcoming drop as the structure got more clarity.

As time goes by and the chart moves to the right, adding more and more bars, we can see the picture even clearer now to adjust both time and price targets for top metals below. Continue reading "Gold & Silver: Last Drop Ahead Of Santa Claus Rally?"

Platinum Could Rocket To $1912

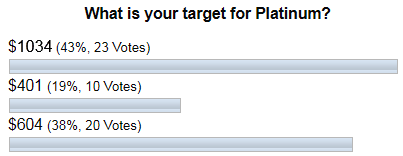
Last time I updated the platinum chart in March was when "Palladium Pushed Platinum To A Record Low" within the ratio mostly due to the strength of palladium. Platinum has hovered around $900 for three years now as it was lost and forgotten after the “execration” of diesel engines. This "fallen angel" had been shaping a sideways consolidation this past spring, and I had thought it could repeat 2018’s drop following the same structure. The targets were set at the $640 and $401 on the downside, and the invalidation point was assigned to $1034.

Let's see below how you voted for the future of platinum.

Platinum

Most of you picked the $1034 option, which implied the breakout of the consolidation in the upside direction towards the invalidation area. This was the closest call as the majority voted for a bullish move, which, indeed, had happened as platinum couldn't break below the consolidation valley of $788 and bounced up to reach the $1000 level this past September. That price hasn't been seen since February 2018. Again, this was your amazingly accurate prediction, not only for that period but also for a longer-term outlook as I spotted it in the big chart below. Continue reading "Platinum Could Rocket To $1912"

Gold & Silver: Expected Drop Kicked Off

It was a timely call last week to "Beware Of Extended Consolidation" as right from last Monday we saw both metals plummet all the week long. Surely, it wasn't a self-fulfilling prophecy as the market was unexpectedly caught in a bullish euphoria. The chart structure was telling us about this possibility as such patterns appear from time to time. The same pattern had appeared on the Bitcoin chart as I had warned you this past August. That pattern of extended consolidation smashed Bitcoin’s value as planned from $10600 down to the projected target of $7800. Let's see where this pattern could send precious metals prices this time around.

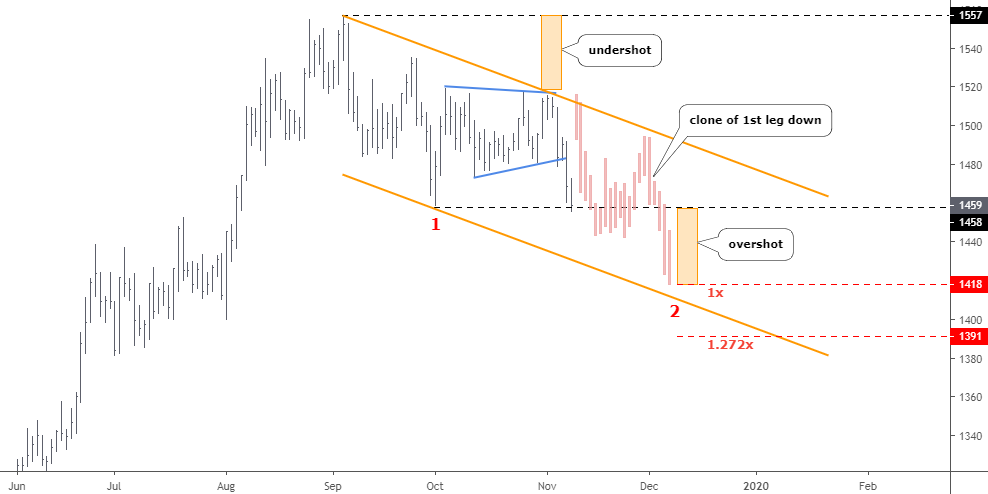
Chart 1. Gold Daily: Undershot => Overshot

gold silver
Chart courtesy of tradingview.com

We've got the tricky junction between two legs down on the gold chart. The triangular structure (blue) had been shaped as lower peaks, and higher valleys were established there. This pattern is rarer than the regular zigzag that I was expecting to unfold. It created a huge undershot to the top of the range, which might result in a big overshot below the bottom of the range. By the way, gold already dropped like a rock to pierce the valley of the range last Friday. But, of course, that's not enough. Continue reading "Gold & Silver: Expected Drop Kicked Off"

Gold & Silver: Beware Of Extended Consolidation

Gold and silver chart structures got synchronized, and I am happy to bring them back together in this post.

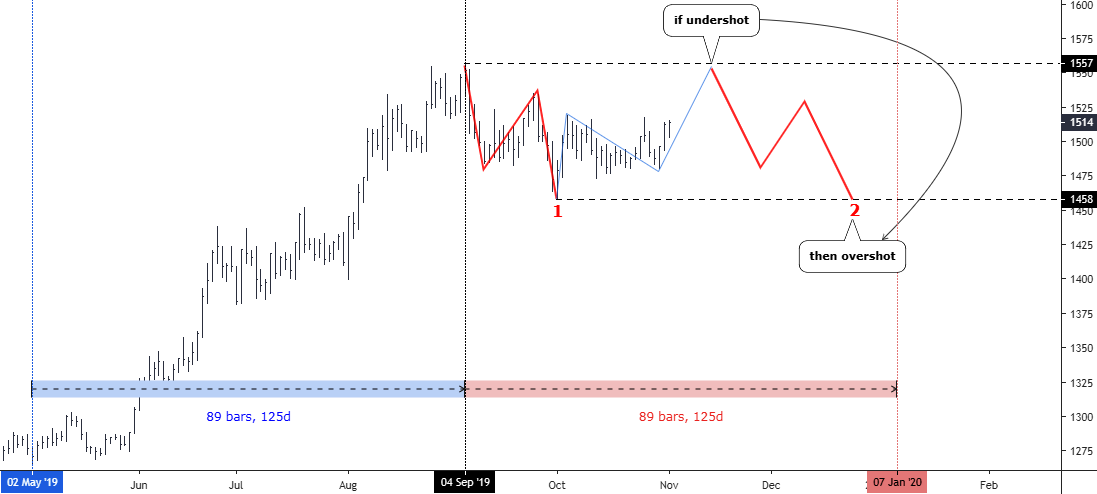
Chart 1. Gold Daily: $1557=>$1458

gold silver
Chart courtesy of tradingview.com

In my earlier post, I shared with you a detailed 4-hour chart of gold with a bullish outlook. Fortunately, the price had indeed gone higher and booked $27 per each ounce since then. I set the confirmation above $1520, which wasn't triggered yet, although we were very close as a high was hit at $1518 at the end of October. Continue reading "Gold & Silver: Beware Of Extended Consolidation"