Investor Alert: Hidden Gem for Stocks Found in Friday Report

Please enjoy this updated version of weekly commentary from the Reitmeister Total Return newsletter. Steve Reitmeister is the CEO of StockNews.com and Editor of the Reitmeister Total Return.Click Here to learn more about Reitmeister Total Return


SPY – Stocks have been pressing lower of late as the bond rates continue to rise. This had the S&P 500 (SPY) dangerously close to the 200 day moving average. Yet hidden in the Friday Government Employment report was a clue that sparked a rally and maybe puts an end to recent market weakness. Read on below for full details….

Right now the most important thing on investor’s minds is the dramatic rise in bond rates, and how that makes stocks less attractive. I tackled that subject pretty thoroughly in my previous commentary this week. Be sure it read now if you haven’t already:

When is the Stock Bouncing Coming?

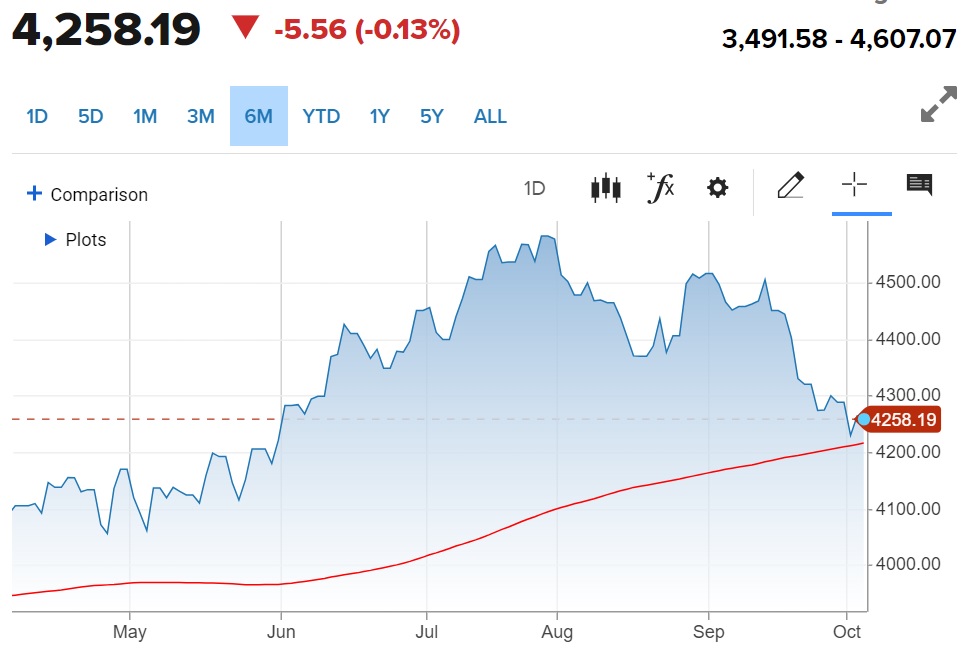
The quick answer to the above question, is that the bounce could be forming now as stock flirt with the 200 day moving average at 4,206 for the S&P 500 (SPY). That is the red line in the chart below.

On the fundamental front, if rates keep ripping higher, then it will only put more pressure on stock prices. I sense that 5% is a logical top for 10 year rates…but who says that the market is logical?

Also note on the fundamental end of things that the economic reports continue to come in positive. Even 20 months into the most aggressive Fed rate hiking regime in history, GDP estimates continue to be robust.

GDP Now has it their Q3 estimate all the way up to +4.9% bolstered by the most recent ISM Manufacturing report. Further, the Blue Chip Economist panel sees +2.9% as the more logical growth trajectory.

If I were to place a bet in Vegas I would say the Economists are much closer to the final number. Regardless, it is hard to look at these results and see a recession coming…and therefore it is hard to be truly bearish.

On top of that the Government Employment Situation report came out Friday morning much hotter than expected. Since so much of the initial market reaction is based on just reading the headline…then yes stocks sold off early in the session.

Gladly, as prudent investors dug into the details they discovered a hidden gem in the report. That being month over month wage inflation down to only 0.2% which means we are ebbing ever closer to the 2% inflation target for the Fed as this “sticky” form of inflation becomes unstuck at such high levels.

As this new spread…so too did the stock gains. As I put this commentary to rest with 90 minutes left in the Friday session we have a +1.4% result for the S&P 500 and nicely above recently resistance at 4,300.

Back to the big picture conversation about higher rates….

Yes, stock prices are down of late as “rates normalize” to more traditional historic levels. Meaning we are no longer enjoying the artificially low rates we that have been in hand the past 15 years.

Once everyone makes this adjustment to the new world view of rates…and realize the world is not falling apart…they will be compelled to put their money into the best stocks. And maybe Friday’s rally is an early sign of that taking place.

So, which are those best stocks, you ask?

Read on below for the answer…

What To Do Next?

Discover my brand new “2024 Stock Market Outlook” covering:

  • Bear Case vs. Bull Case
  • Trading Plan to Outperform
  • What Industries Are Hot…Which Are Not?
  • Top 11 Picks for the Year Ahead
  • And Much More!

Gain access to this vital presentation now by clicking below:

2024 Stock Market Outlook >

Wishing you a world of investment success!


Steve Reitmeister
…but everyone calls me Reity (pronounced “Righty”)
CEO, StockNews.com & Editor, Reitmeister Total Return


SPY shares were trading at $430.05 per share on Friday afternoon, up $5.55 (+1.31%). Year-to-date, SPY has gained 13.70%, versus a % rise in the benchmark S&P 500 index during the same period.


About the Author

Steve is better known to the StockNews audience as “Reity”. Not only is he the CEO of the firm, but he also shares his 40 years of investment experience in the Reitmeister Total Return portfolio. Learn more about Reity’s background, along with links to his most recent articles and stock picks.

Top 3 Stocks Investors Should Steer Clear From as Oil Prices Skyrocket

The U.S. WTI Crude prices have escalated to the highest since August 2022, breaking the $95 per barrel resistance level. The international benchmark, Brent Crude, has hit a new record for 2023, beating $97 per barrel.

However, crude oil prices faced significant drops. Brent Crude decreased by nearly 12%, while WTI declined by almost 9%. The sudden crash was instigated by a report from the Energy Information Administration (EIA) citing weak U.S. gasoline demand, resulting in an abrupt shift in market sentiment. Tensions were exacerbated further by a bond market selloff, stimulating concerns about the future of the global economy and oil demand.

Despite the reduction, price levels remain high, potentially instigating economic challenges for industries closely tied to the energy sector.

However, before delving into the implications for related industries, a discussion regarding the reasons behind these unprecedented oil price levels is crucial.

According to the global energy watchdog, the International Energy Agency’s (IEA) Oil Market Report (OMR), global oil demand remains on track to rise by 2.2 million b/d year-over-year to 101.8 million b/d in 2023, fueled by rejuvenated Chinese consumption and increasing demands for jet fuel and petrochemical feedstocks.

According to Standard Chartered commodity analysts' data, the U.S. oil demand demonstrates resilience and outpaces previous forecasts – bolstering the assertion of burgeoning gasoline and jet fuel demands that align with household behavior patterns. The EIA projects an annual boost in initial gasoline demand of 98 kb/d.

Goldman Sachs predicts the persistent demand to culminate in a larger-than-anticipated deficit of up to 1.8 million bpd during the latter half of 2023 and a 600,000 bpd deficit in 2024.

Other factors influencing supply and demand dynamics revolve around OPEC+ and Russia’s orchestrated production cuts and extensive crude draws, suggesting a probable surge in oil prices. Unexpected supply disruptions from Angola, Libya, and Nigeria might enhance oil prices. These elements point to a robustly bullish forecast for the remainder of the year.

Industry analysts project the growing trend in oil prices to persist. Norwegian oil and gas firm Equinor’s chief economist anticipates global crude oil prices could reach $100 a barrel.

Data from the U.S. Energy Information Administration (EIA) unveils crude stocks at the Cushing, Oklahoma storage hub, which is the delivery point for U.S. crude futures, plunged by 943,000 barrels in the fourth week of September to less than 22 million barrels, the lowest since July 2022. This incited an energy price surge.

Although the oil prices have eased, they remain well above and potentially detrimental to numerous businesses. Industries such as air travel and cruise operators, which heavily rely on fuel derived from oil, bear the burden of these soaring prices. Potential consequences include less consumer travel due to escalating airline ticket prices, resulting in repercussions for businesses within the tourism sector. Additionally, profits may decline significantly for chemical companies that utilize large quantities of oil for products such as paint.

Therefore, investors may want to avoid the following three stocks until oil prices decrease more substantially:

Delta Air Lines, Inc. (DAL)

DAL provides scheduled air transportation services for passengers and cargo in the U.S. and internationally.

Crude oil is the predominant raw material for jet fuels and the lifeblood of airplanes. Jet fuel expenses, one of the most significant expenses for airlines, account for 10% and 12% of airlines’ operating costs. Hence, elevated oil prices increase jet fuel costs and can significantly impact the profitability and cash flow of DAL and other similar airline operators.

High oil prices can coerce airlines to compensate by inflating ticket prices or incorporating supplementary charges. Therefore, the interest in air travel, particularly for discretionary and leisure trips, could dwindle, resulting in a decreasing demand.

DAL’s CEO Ed Bastian previously cautioned that elevated oil prices and increased government regulations could catalyze a surge in ticket prices.

Moreover, DAL is known for delivering high-quality service backed by well-trained staff and a customer-centric approach. The company's commitment to uphold these standards and offer amenities inevitably influences ticket prices.

DAL’s oil refinery in Trainer, Pennsylvania, purchased in 2012, processes jet fuel, gasoline, and diesel. The airline company strategized to use this refinery as a hedge against fluctuating oil prices and costs related to jet fuel. However, the strategy was ineffective, as the refinery suffered losses amid maintenance challenges, pipeline disruptions, and unfavorable market conditions.

Moreover, as of June 30, 2023, DAL's adjusted net debt stood at $19.84 billion, marking a 1.3% increase year-over-year.

Recently disclosed quality issues with RTX’s Pratt & Whitney engines are expected to impact the U.S. carrier moderately. The problem arose due to a powder metal defect that may cause cracks in some components of the engines. Despite an initial estimation by RTX of repair work lasting 60 days per engine, it is expected to take up to 300 days.

DAL has trimmed its third-quarter operating margin and profit forecasts as Russia and Saudi Arabia’s extended oil production cuts amplified the airline's fuel expenditures. The carrier anticipates a third-quarter profit ranging from $1.85 to $2.05 per share, a drop from its earlier estimate of $2.20 to $2.50 per share.

Considering all these circumstances, it might be judicious to avoid DAL stock now.

Carnival Corporation & plc (CCL)

A leading provider of leisure travel services, CCL, operating a fleet of over 90 ships accessing nearly 700 ports, faces significant hindrances surrounding fuel costs due to rising crude oil prices. This scenario creates a negative backdrop for CCL and other cruise line operators, where the operational expense, mainly fuel, is expected to spike.

Passenger ticket surcharges are often a response to these inflationary trends. Considering this, CCL’s CEO, Josh Weinstein, indicated that a fuel surcharge is "certainly not off the table." However, this move might trigger a plunge in demand for cruises, particularly with the end of “revenge travel” and grappling with increased inflation. Cruise operators could see their profitability significantly impacted due to burgeoning oil prices, resulting in a notable hit to CCL’s bottom line.

As of August 31, 2023, CCL’s debt (current and long-term) stood at $31.30 billion. Moreover, despite high-ticket pricing driving CCL into third-quarter profitability and narrowing its annual loss forecast, the company anticipates a larger-than-predicted fourth-quarter loss. The predicted net impact of $130 million from advanced fuel costs and unfavorable currency exchange rates could eliminate most of the third quarter's ex-currency, ex-fuel $200 million outperformance.

Also, costs are projected to be further escalated by an assumed 18% rise in dry dock days for maintenance and repairs in 2024.

In 2024, the confluence of CCL taking ownership of three new vessels and a year marked by extensive maintenance could also add further financial strain. Despite potential offsets due to export credits, new capacity will lead to incremental costs and increased capital expenditures. Consequently, this surge in portfolio growth, together with the extended dry-dock days, would likely cut into the following year's free cash flow, even with robust demand.

Given the likelihood of reduced profit margins and dwindling demand due to inflated prices, it may be prudent to approach CCL cautiously.

Akzo Nobel N.V. (AKZOY)

Based in Amsterdam, the Netherlands, AKZOY is a global producer and seller of paints and coatings.

A key component in their production process is crude oil, which creates various elements such as solvents, resins, pigments, additives, and binders. As per some estimates, crude oil derivatives constitute about 40% of the total raw materials required for paint production.

Certain petroleum-based components are indispensable for specific paints or applications, making their substitution challenging without affecting the paint's quality or performance. A direct correlation exists between crude oil prices and the cost of manufacturing paint. Therefore, elevated crude oil prices present significant challenges to paint companies.

Increased oil prices increase the production costs for paint manufacturers, resulting in diminished profitability and growth opportunities for these companies.

Paint companies often transfer these costs to their customers to cope with inflated input costs. However, high prices can negatively affect paints' demand and sales volume, especially in a fiercely competitive market.

AKZOY is experiencing this challenge, making it a potentially less attractive stock option. The company could suffer substantial negative impacts due to lower housing starts in the U.S. and Europe’s weak economic growth.

The company's revenue dropped by 3.9% year-over-year in the second quarter of the year. Furthermore, the Net Debt/EBITDA or leverage ratio for the year's first half increased to 4x, compared to 3.2x during the prior-year period. Higher oil prices are forecasted to decrease its operating income this quarter significantly.

Therefore, these stocks could be best avoided now.

4 Streaming Stocks to Buy Instead as Netflix Faces Lawsuit

Streaming giant Netflix, Inc. (NFLX) finds itself in the center of a lawsuit over the upcoming Zack Snyder sci-fi epic Rebel Moon. NFLX has been sued for axing a gaming development contract based on filmmaker Snyder’s much-anticipated franchise, originally created as a “Star Wars” movie.

On September 28, 2023, Evil Genius Games filed a lawsuit against NFLX at the U.S. District Court in the Central District of California. Evil Genius Games is a popular developer and publisher of tabletop role-playing games based on major motion picture franchises.

The plaintiff has claimed that it had begun working with NFLX earlier this year to develop a tabletop role-playing game (TTRPG) based on Snyder’s “Rebel Moon,” and the game’s release was supposed to have coincided with the release of the first film’s streaming release on December 22, 2023.

According to the plaintiff, when the two parties started working on the project earlier this year, NFLX had a Rebel Moon movie script, a rough idea about the Rebel Moon universe, and a few cursory graphical assets. However, the script was missing background information vital to the story.

In the court documents, Evil Genius claimed that they not only did the work they were required to do but also supplied all the missing pieces and created a well-integrated backstory for the whole franchise. The plaintiff came up with a 228-page World Bible, a 430-page Player’s Guide, and a 337-page Game Master’s Guide.

Evil Genius had paid NFLX for a license and agreed to share profits from the licensed articles with NFLX. Despite having collaborated for months, NFLX decided to pull the plug on the project on May 25, weeks after the work was finalized and turned over to the streamer.

NFLX alleged that Evil Genius had violated the confidentiality agreement for “Rebel Moon” and violated its trust by sharing artwork at an industry trade show in March 2023. However, the plaintiff maintains that they had acquired NFLX’s permission to show artwork from the game at the 2023 Game Manufacturers Associate Exposition to “create some industry buzz” for the project.

According to the court documents, Evil Genius alleged that two NFLX employees were present at the event and helped hand out materials to retailers at the show. The legal filing states that “It became clear that Netflix was simply using the alleged breach and termination to hijack (Evil Genius’) intellectual property and prevent (Evil Genius’) from releasing the game.”

Evil Genius CEO David Scott said, “Our aim is to ensure our team is recognized for their fantastic work, and that we can release this game for millions of enthusiasts to enjoy. It’s disheartening to see Netflix backpedal on content that was jointly showcased and had received their prior consent. We urge our supporters to contact Netflix and Zack Snyder to push for the release of this game.”

While the allegations on NFLX are severe, the streamer has yet to comment on the lawsuit. In this scenario, investors could look to buy streaming stocks Comcast Corporation (CMCSA), The Walt Disney Company (DIS), Roku, Inc. (ROKU), and Paramount Global (PARA) as they are likely to benefit from NFLX’s bad press.

Let’s delve into the fundamentals of these stocks.

Comcast Corporation (CMCSA)

CMCSA is a media and technology company. Its segments include the Cable Communications segment, Media, and the Studios segment, which includes film and television studio production and distribution operations. The company has three primary businesses: Comcast Cable, NBCUniversal, and Sky.

CMCSA’s revenue grew at a CAGR of 4.6% over the past three years. Its EBITDA grew at a CAGR of 4.1% over the past three years. In addition, its EBIT grew at a CAGR of 4.7% in the same time frame.

CMCSA’s revenue for the second quarter ended June 30, 2023, increased 1.7% year-over-year to $30.51 billion. Its adjusted EBITDA rose 4.2% over the prior-year quarter to $10.24 billion. The company’s adjusted net income increased 4.8% year-over-year to $4.72 billion. Also, its adjusted EPS came in at $1.13, representing an increase of 11.9% year-over-year.

For the quarter ended September 30, 2023, CMCSA’s EPS and revenue are expected to decline 1.4% and 0.4% year-over-year to $0.95 and $29.73 billion, respectively. It surpassed consensus EPS estimates in each of the trailing four quarters.

The Walt Disney Company (DIS)

DIS operates as an entertainment company worldwide. The company engages in film and episodic television content production and distribution activities. It operates through two segments, Disney Media and Entertainment Distribution; and Disney Parks, Experiences, and Products.

On September 11, 2023, DIS and Charter Communications (CHTR) announced a transformative, multiyear distribution agreement to maximize value for consumers and support the linear TV experience. Due to the deal, most DIS networks and stations will be restored to Spectrum’s video customers.

DIS’ revenue grew at a CAGR of 8% over the past three years. Its EBIT grew at a CAGR of 4.6% over the past three years. In addition, its EBITDA grew at a CAGR of 2.5% in the same time frame.

For the third quarter ended on July 1, 2023, DIS’ revenues increased 3.8% year-over-year to $22.33 billion. Its net loss attributable to DIS came in at $460 million, compared to a net income attributable of $1.41 billion in the prior-year quarter.

The company’s loss per share came in at $0.25, compared to an EPS of $0.77 in the prior-year quarter. Also, its cash provided by continuing operations increased 45.8% year-over-year to $2.80 billion. In addition, its free cash flow increased 775.4% year-over-year to $1.64 billion.

Analysts expect DIS’ EPS and revenue for the quarter ended September 30, 2023, to increase 153.2% and 6.4% year-over-year to $0.76 and $21.44 billion, respectively.

Roku, Inc. (ROKU)

ROKU operates a TV streaming platform. The company operates in two segments: Platform and Devices. Its streaming platform allows users to find and access TV shows, movies, news, sports, and others. The company also provides digital advertising and related services. In addition, it offers billing services; and brand sponsorship and promotions, as well as manufactures, sells, and licenses smart TVs under the Roku TV name.

On August 31, 2023, ROKU and TV Azteca announced a strategic partnership that will enable brands and agencies to purchase TV streaming advertising on the Roku platform in Mexico through TV Azteca.

ROKU’s International Advertising Vice President Mirjam Laux said, “The collaboration with TV Azteca increases our reach in the market and is a significant step to expand our growing ad sales business in Mexico. Working with TV Azteca, a trusted media group with deep connections to brands and advertisers, helps us to accelerate our advertising business and create more impactful marketing.”

ROKU’s revenue grew at a CAGR of 33.6% over the past three years. Its Tang Book Value grew at a CAGR of 32.3% over the past three years. In addition, its Total Assets grew at a CAGR of 31.1% in the same time frame.

ROKU’s total net revenue for the second quarter ended June 30, 2023, increased 10.8% year-over-year to $847.19 million. Its total gross profit rose 6.5% year-over-year to $378.27 million. The company’s net loss narrowed 4.2% year-over-year to $107.60 million. Also, its loss per share narrowed 7.3% year-over-year to $0.76.

Street expects ROKU’s revenue for the quarter ended September 30, 2023, is expected to increase 11.6% year-over-year to $849.38 million. Its EPS for the same quarter is expected to decline 124.5% year-over-year to $1.98. It surpassed the Street EPS estimates in each of the trailing four quarters.

Paramount Global (PARA)

PARA operates as a media and entertainment company worldwide. The company operates through TV Media, Direct-to-Consumer, and Filmed Entertainment segments.

On August 7, 2023, PARA and KKR announced signing an agreement pursuant to which KKR will acquire Simon & Schuster. PARA’s President and CEO Bob Bakish said, “We are pleased to have reached an agreement on a transaction that delivers excellent value to Paramount shareholders while also positioning Simon & Schuster for its next phase of growth with KKR.”

“The proceeds will give Paramount additional financial flexibility and greater ability to create long-term value for shareholders while also delivering our balance sheet,” he added.

PARA’s revenue grew at a CAGR of 5.7% over the past three years. Its levered FCF grew at a CAGR of 2.3% over the past three years. In addition, its Total Assets grew at a CAGR of 2.7% in the same time frame.

For the fiscal second quarter ended June 30, 2023, PARA’s revenue declined 2.1% year-over-year to $7.62 billion. Its adjusted OIBDA declined 37% over the prior-year quarter to $606 million.

The company’s adjusted net earnings from continuing operations attributable to PARA declined 81.4% year-over-year to $80 million. Its adjusted EPS from continuing operations attributable to PARA came in at $0.10, representing a decline of 84.4% year-over-year.

For the quarter ended September 30, 2023, PARA’s revenue is expected to increase 4.2% year-over-year to $7.21 billion. Its EPS for the same quarter is expected to decline 70.9% year-over-year to $0.11.

Auto Industry Turmoil Causes Interest in 3 Top Stocks Over GM, Ford, and Stellantis


The automotive industry has been navigating a tumultuous period, surrounded by a still high inflation and rising interest rates. Although a resurgence in electric vehicle demand has provided a fleeting respite, residual tension is palpable due to potential strikes led by the United Auto Workers (UAW) union at Stellantis (STLA), Ford Motor Company (F), and General Motors (GM).

The UAW, representing 46,000 GM workers, 57,000 Ford employees, and 43,000 STLA workers, initiated negotiations with the auto giants in July. Historically, the UAW would choose one from these Detroit Three to lead the talks, using it as a blueprint for the remaining deals. However, this time, union President Shawn Fain has opted to negotiate with all three simultaneously after reporting no significant progress with Ford and GM.

About 25,000 UAW members associated with the Detroit Three, representing about 17% of the total membership, are striking at 43 facilities across 21 states. In Michigan alone, two automotive plants – each owned by GM and Ford – and 13 parts distribution centers are impacted, affecting over 9,000 UAW members.

A pivotal demand for the UAW is the elimination of the two-tier wage system, which sees new hires earning significantly less than the veterans. The union is expected to advocate for the reinstatement of pay raises tied to living costs and retirement benefits reduced during the 2008-2009 financial crisis.

Armed with the awareness of automakers' recent financial success and considering substantial executive compensation and sizeable federal subsidies for EV sales, the UAW is pressing for notable salary increases. It also demands the restoration of defined benefit pensions for all workers, reducing the work week to 32 hours, ensuring job security, and ending the use of temporary workers.

Despite challenging negotiations, STLA has proffered a significant offer to the union. Further, talks with Ford are advancing, outlining agreeable terms on wages and benefits.

Impacts of the Strike

On the Detroit Three

As the UAW strike enters its third week, broadening its scope to encompass Ford and GM, an ominous cloud looms over the U.S. automobile industry. Industry experts have expressed concerns, cautioning that these actions could potentially fast-track these corporations toward bankruptcy.

According to prior estimates by Deutsche Bank, a comprehensive strike impacting all car manufacturers could result in losses between $400 million to $500 million per week, assuming all production is stalled. While some losses may be offset with increased production rates once the strike concludes, this option becomes less likely if the labor dispute prolongs for weeks or months.

In fiscal 2019, GM's fourth-quarter earnings suffered significantly due to the 40-day UAW strike, with profits plunging by $3.6 billion. Morgan Stanley analyst Adam Jonas assessed that one month of total production loss could equal between $7 billion and $8 billion in forfeited profits across all three auto giants.

While the ongoing strike has largely impacted Detroit automakers, its effect on GM’s third-quarter new vehicle sales in the U.S. was limited. GM reported a promising 21.4% surge in sales from July through September, outpacing industry anticipations of a 15% to 16% increase. Sales across all of GM’s brands experienced a year-over-year growth.

However, STLA witnessed a 1.3% downfall in sales during the third quarter, an outcome more likely linked to its pricing strategy than the UAW labor dispute.

Although the impact of work stoppages has not yet affected GM and other firms, potential supply chain disruptions and sales complications may arise if the strike extends or amplifies. The dispute's ramifications could grow significantly in October, particularly concerning specific models such as the Chevrolet Colorado and GMC Canyon midsize pickups that have already witnessed production reduction.

The prevailing strike could taint the reputation of the auto behemoths, leading to customer dissatisfaction due to potential delays, cancellations, or quality issues resulting from the strike.

Furthermore, strike-induced increased production costs could dampen profits for these car manufacturers, forcing them to offer higher wages and benefits to UAW employees. This could adversely affect their financial standing, limiting their capacity to invest in new technologies, products, and markets.

Job Loss

The economic impact so far has been relatively subdued compared to preliminary expectations before the UAW's unexpected strategy of targeting specific plants. It is essential to recognize the increasing job losses, coupled with layoffs in ancillary automotive suppliers, which are expected to intensify in the upcoming days.

F’s additional 330 layoffs at the Chicago stamping plant and the Lima engine plant amid the ongoing strike brought the laid-off workers to 930.

According to predictions by the University of Michigan economist Don Grimes, Michigan is projected to see up to 18,495 job cuts by the end of the week, including layoffs in auto suppliers, and are a direct consequence of the escalating strike tactics deployed by the UAW. Nationwide, potential job losses are predicted to reach up to 65,640 this week.

However, these job losses could have been significantly higher if the UAW had followed the conventional approach of targeting all operations of a single automaker when contract negotiations reached an impasse.

On the Economy

As per the University of Michigan economist Don Grimes, the UAW strike timing is especially troublesome for economic growth overall, given that October typically heralds the beginning of student loan repayments following a pause that had lasted for over three years, shrinking consumer savings due to depleted emergency funds accumulated during the pandemic and the rising interest rates that are expected to beset overall growth.

Moody's economist, Mark Zandi, said, "If the UAW strike lasts through the end of October as we anticipate, it will reduce annualized real GDP growth in the fourth quarter by another estimated 0.3 percentage point."

This estimate considers the direct impact of stalled car and parts manufacturing potential downstream effects on suppliers and auto dealers, coupled with decreased spending due to wage losses incurred by workers participating in the strike. With the collective weight of these adverse factors, the U.S. economy could head into a challenging fourth quarter.

On Competitors

As the strike impacts the Detroit Three, industry players Toyota Motor Corporation (TM), Mercedes-Benz Group AG (MBGAF), and AB Volvo (publ) (VLVLY) could significantly benefit from the chaos.

These automotive titans, having unions such as Germany's IG Metall, Sweden's IF Metall and Unionen, and Japan's Toyota Motor Workers’ Union, have a limited presence in UAW.

Such companies stand to service customers seeking alternatives to products from the Detroit Three. By continuing to deliver reliable and high-quality vehicles, its strong suit being luxury sedans, SUVs, and EVs, these automakers could further enhance their reputations and customer loyalty.

Additionally, these corporations could utilize their global footprint and remarkable efficiency to sustain a competitive edge and maintain a leadership position in innovation.

Auto industry powerhouses TM, MBGAF, and VLVLY have also invested substantially in pioneering technologies such as electrification, autonomous driving, and connectivity.

Contemplating the advantage these three car manufacturers currently hold over the Detroit Three amid unresolved worker strikes, it seems prudent to examine the other elements making their stocks an attractive investment endeavor now:

Toyota Motor Corporation (TM)

Based in Toyota, Japan, TM, with a market cap of over $229 billion, manufactures and sells passenger, minivans, commercial vehicles, and related parts and accessories globally.

It pays an annual dividend of $4.99 per share, translating to a dividend yield of 2.55%. Its four-year average yield is 2.81%. Its dividend payouts grew at a CAGR of 1.6% over the past three years and 1.3% over the past five years.

TM’s trailing-12-month EBIT and EBITDA of 8.33% and 12.62% are 13.2% and 14.3% higher than the industry averages of 7.36% and 11.04%, respectively. Its trailing-12-month cash from operations of $24.60 billion is significantly higher than the industry average of $223.80 million.

In terms of forward P/E, TM is trading at 9.12x, 36.1% lower than the industry average of 14.28x. Its forward Price/Cash Flow multiple of 5.28 is 26.7% lower than the industry average of 7.95.

TM’s global sales report for August 2023 notched an impressive 9% year-over-year growth to 923,180 vehicles. The automotive giant increased its production by 4.3%, manufacturing an impressive 924,509 vehicles within the month. Fueling the company's solid performance was a favorable surge in domestic demand coupled with a robust recovery of the semiconductor supply chain.

TM’s sales revenues increased 24.2% year-over-year to ¥10.55 trillion ($70.75 billion) for the fiscal first quarter that ended June 30, 2023. Its operating income increased 93.7% year-over-year to ¥1.12 trillion ($7.52 billion). Net income attributable to TM increased 78% year-over-year to ¥1.31 trillion ($8.80 billion), while earnings per share attributable to TM stood at ¥96.74, up 80.6% from the year-ago quarter.

According to a Nikkei report, TM has told its suppliers that it plans to make 150,000 EVs this year, 190,000 in 2024, and 600,000 in 2025.

Analysts expect TM’s revenue and EPS for the fiscal year (ending March 2023) to increase 3.2% and 597.3% year-over-year to $285.31 billion and $18.60, respectively. Also, the company topped the consensus revenue estimates in each of the trailing four quarters, which is impressive.

Over the past year, the stock gained more than 21%. The stock is trading above the 100-day and 200-day moving averages of $163.50 and $151.44, indicating an uptrend. Wall Street analysts expect the stock to reach $207.79 in the next 12 months, indicating a potential upside of 22.6%.

Mercedes-Benz Group AG (MBGAF)

MBGAF, a German car maker with a market cap of over $74 billion, develops, manufactures, and sells premium and luxury cars and vans under the Mercedes-AMG, Mercedes-Benz, Mercedes-Maybach, and Mercedes-EQ brands, as well as related spare parts and accessories.

In a significant development, the company recently signed an agreement with Steel Dynamics Inc. (SDI) to procure over 50,000 tons of carbon-reduced steel annually for its Tuscaloosa, Alabama facility. This transaction signifies an essential step forward in the company's ongoing initiative to decarbonize its worldwide steel supply chain, which is anticipated to enhance its corporate sustainability profile significantly.

It pays an annual dividend of $5.72 per share, translating to a dividend yield of 8.36%. Its four-year average yield is 5.02%. Its dividend payouts grew at a CAGR of 24.2% over the past three years and 14.8% over the past five years.

MBGAF’s trailing-12-month ROCE and ROTA of 18.69% and 5.95% are 64.1% and 54.7% higher than the industry averages of 11.39% and 3.85%, respectively. Its trailing-12-month cash from operations of $17.76 billion is significantly higher than the industry average of $223.80 million.

In terms of forward non-GAAP P/E, MBGAF is trading at 4.74x, 66.2% lower than the industry average of 14.02x. Its forward EV/Sales multiple of 1.03 is 9.2% lower than the industry average of 1.13.

MBGAF’s revenues for the fiscal second quarter that ended June 30, 2023, increased 4.9% year-over-year to €38.24 billion ($40.12 billion). Its adjusted EBIT rose 5.5% from the year-ago quarter to €5.21 billion ($5.47 billion). The company’s net profit and earnings per share rose 13.9% and 14.8% year-over-year to €3.64 billion ($3.82 billion) and €3.34.

Analysts expect MBGAF’s revenue for the fiscal year (ending December 2023) to increase 2% year-over-year to $163.68 billion, and EPS is expected to come at $14.21. Also, the company topped the consensus revenue estimates in three of the trailing four quarters.

Over the past year, the stock gained more than 24%. Wall Street analysts expect the stock to reach $92.40 in the next 12 months, indicating a potential upside of 34.9%. The price target ranges from a low of $73.28 to a high of $125.62.

AB Volvo (publ) (VLVLY)

VLVLY, a Swedish carmaker with over $42 billion market cap, manufactures and sells trucks, buses, and related heavy industrial equipment globally.

Recently, Volvo Defense, a business operation within Volvo Trucks, has entered a framework agreement with the Estonian Centre for Defense Investments and the Ministry of Defense of the Republic of Latvia to deliver logistic trucks. Volvo was chosen as one of two suppliers that combined will deliver up to 3,000 vehicles over seven years. This should bode well for the company.

VLVLY pays an annual dividend of $0.68 per share, translating to a dividend yield of 3.35%. Its four-year average yield is 7.27%. Its dividend payouts grew at a CAGR of 6.1% over the past five years.

VLVLY’s trailing-12-month ROCE, ROTC, and ROTA of 24.77%, 9.43%, and 5.74% are 82.3%, 38.9%, and 13.8% higher than the industry averages of 13.59%, 6.79%, and 5.04%, respectively.

In terms of forward non-GAAP P/E, VLVLY is trading at 8.10x, 52.2% lower than the industry average of 16.94x. Its forward EV/Sales multiple of 1.20 is 26.6% lower than the industry average of 1.64.

During the fiscal second quarter of 2023, VLVLY’s net sales increased 18.4% year-over-year to SEK140.82 billion ($12.71 billion). Its gross income rose 35.5% year-over-year to SEK38.92 billion ($3.51 billion). Its adjusted operating income grew 58.1% from the year-ago quarter to SEK21.73 billion ($1.96 billion).

Furthermore, the company’s income for the quarter grew 2.8% year-over-year to SEK10.82 billion ($976.92 million), and its EPS was SEK5.30, an increase of 3.1% over the previous year’s quarter. Also, its operating cash flow from industrial operations rose 74.4% year-over-year to SEK12.55 billion ($1.13 billion).

Analysts expect VLVLY’s revenue and EPS for the fiscal year (ending December 2023) to increase 3.1% and 44.1% year-over-year to $47.57 billion and $2.49, respectively. Also, the company topped the consensus revenue estimates in three of the trailing four quarters, which is impressive.

Over the past year, the stock gained more than 32% and currently trades above the 200-day moving average of $19.75. Wall Street analysts expect the stock to reach $22.51 in the next 12 months, indicating a potential upside of 11.4%. The price target ranges from a low of $19.25 to a high of $25.58.

Bottom Line

The auto industry in the U.S. represents approximately 4% of the nation's GDP. Therefore, increasing momentum within the industry could propel a more comprehensive economic revival.

Despite obstacles, the auto industry exhibited impressive resilience, maintaining operations, meeting consumer demands, and strategically seeking growth opportunities. The embodiment of this stability is evidenced in the surge of new vehicle sales in August, registering double-digit percentage increases compared to a year ago. Global auto sales for 2023 are anticipated to reach 86.8 million units, surpassing the previous estimate of 86.4 million units.

Considering the overall scenario, the robust financial performances of TM, MBGAF, and VLVLY, combined with their compelling valuation metrics, consistent profitability, dynamic advancements, strategic partnerships, and optimistic analyst estimates, make the stocks more favorable portfolio additions than the Detroit Three, which are currently grappling with the fallout from labor strikes.
When is the Stock Bounce Coming?

Please enjoy this updated version of weekly commentary from the Reitmeister Total Return newsletter. Steve Reitmeister is the CEO of StockNews.com and Editor of the Reitmeister Total Return.Click Here to learn more about Reitmeister Total Return


SPY – Higher bond rates have been the main catalyst behind lower stock prices. Yet with the S&P 500 (SPY) pressing down towards the 200 day moving average we are all wondering when stocks will finally bounce. Steve Reitmeister reviews the facts in hand to help investors navigate the choppy investment waters. Read on below for the full story…

In last week’s commentary I focused on the following relationship:

Rates Up > Stocks Down

Now everyone is quite aware of this dynamic explaining the continued pressure on stock prices with the S&P 500 (SPY) at the lowest level in months.

However, what remains unclear to most is… WHY it this happening…and how much higher could rates go?

That will be the focus of this week’s Reitmeister Total Return commentary.

Market Commentary

The reason for higher long term bond rates is quite simple…and actually has nothing to do with current inflation issues which are likely to fully moderate in the coming 12-24 months. What this boils down to is the following term that you will see more and more:

Rate Normalization

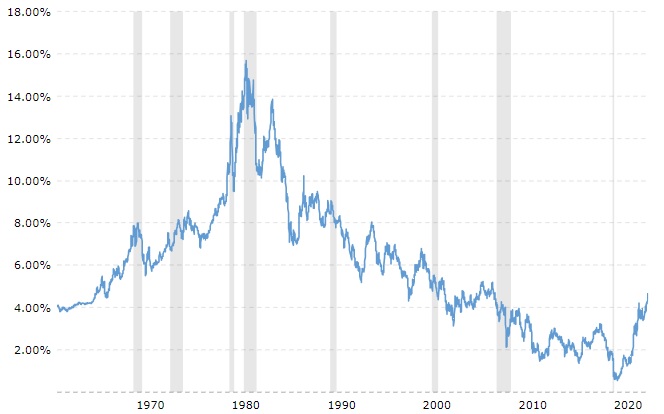
Meaning that rates have been “abnormal” ever since the Great Recession as the Fed used every tool imaginable to crush interest rates to reinvigorate the economy. The ante got upped during Covid with rates tumbling down to a historic low of 0.5% for the 10 year Treasury.

Let’s review this 60 year chart to appreciate the trends over the years:

There really have been 2 abnormal periods in history. We just spoke about rates tumbling to all time lows after the Great Recession through Covid (2008-2020).

Now check out the spike in rates during the hyper-inflation period of the late 1970’s. This peaked in 1982 thanks to the hard work of then Fed Chair Volker.

So what are normal rates for the 10 year Treasury?

There is some debate, but most say 4.5% to 5%.

Where are we today? Smack dab in the middle at 4.79%.

Yes, that is much higher than recent memory…but not really high in the grand scheme of history. And thus not necessarily a reason for the economy to come to a screeching halt and thus not a reason to flee stocks in the long run.

Yet in the short run, some adjustments to investment portfolios have to be made. For example, with yields this high we all can get a decent rate of return with bonds and money market accounts without taking any real risk. This is having more money flowing out of stocks towards bonds.

That is not a brand new phenomena as bond fund flows have been very positive since late 2022. The greater question now is when will we hit peak rates…and thus when will the stock market carnage end?

If you line up 10 investment experts, they will give you 10 different opinions. Because to be honest, 90% of them didn’t really see this coming. And thus cant give a straight answer on how/when it ends.

That is why I thought valuable to draw back to the picture of the historical rates. When you remove the abnormal highs and lows you find that we are pretty close to normal. So, it is fair to imagine that 5% could present a reasonable near term top for rates.

Unfortunately…who says that the market is rational?

The bond market gets hit with waves of fear and greed just like the stock market. And thus we could easily go well past 5% bond rates before things correct back to normal levels. And yes, that would be bad for stock prices.

Truly we are at a critical juncture. Not just about the direction of bond rates, but also stocks are on closing in on the most important technical level. More on that in the next section.

Price Action & Trading Plan

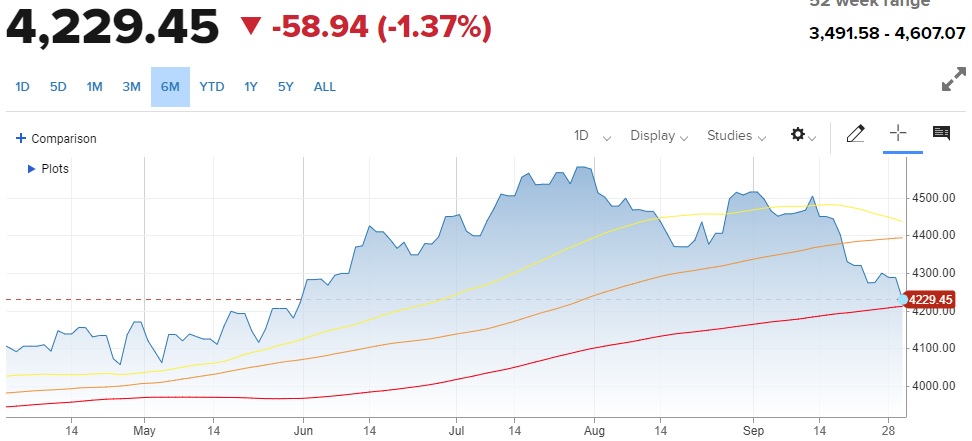
Moving Averages: 50 Day (yellow), 100 Day (orange), 200 Day (red)

There is no way to paint this picture in a positive light. As you can see, this past month stocks have broken down past support at the 50 day and 100 day moving averages. So obviously now we are all wondering how well the 200 day moving average will hold up at 4,202.

Personally, I like the odds of seeing solid short term support at this level. BUT if the 10 year Treasury rates start raging above 5%…then I suspect stocks will spend some time below the long term trend line only adding to recent negativity.

As for our trading strategy, we are 100% invested and have taken advantage of the recent dip to add stocks & ETFs that should excel when a bounce finally ensues. But a serious break below the 200 day moving average would have me consider more conservative measures. Like perhaps retreating to 70-80% long.

Why not more conservative or even bearish?

Would need to see more serious reason to believe in a recession forming that would provide a fundamental reason for extended stock downside. OR a deeper break under the 200 day that would have to be heeded in our strategy.

Either one of these would have use getting less long stocks…and potentially buying inverse ETFs to profit from downside.

Hard to explain why…but I have little fear of that at this moment. And just sense a bounce should soon be in hand with the picks in our portfolio leading the parade higher.

What To Do Next?

Discover my brand new “2024 Stock Market Outlook” covering:

  • Bear Case vs. Bull Case
  • Trading Plan to Outperform
  • What Industries Are Hot…Which Are Not?
  • Top 11 Picks for the Year Ahead
  • And Much More!

Gain access to this vital presentation now by clicking below:

2024 Stock Market Outlook >

Wishing you a world of investment success!

About the Author

Steve is better known to the StockNews audience as “Reity”. Not only is he the CEO of the firm, but he also shares his 40 years of investment experience in the Reitmeister Total Return portfolio. Learn more about Reity’s background, along with links to his most recent articles and stock picks.