Market Breaks Out Of Trading Range

Hello traders everywhere. In Wednesday's video, I discussed how the market had been stuck in a trading range for the last month and that we needed to see a move above the 50-day MA to potentially see a move higher. Well, we got that move on Thursday when the news of an agreement between China and the U.S. to set a meeting for trade talks hit the wire resulting in a big move higher which resulted in three new green weekly Trade Triangles being issued for the S&P 500, NASDAQ and DOW.

The market is ending the week relatively quiet as the U.S. economy added 130,000 jobs in August, the Labor Department said. Economists polled by Dow Jones expected jobs to grow by 150,000 last month. Unemployment remained steady at a rate of 3.7% while wages rose more than expected. Wages expanded by 0.4% on a month-over-month basis and by 3.2% year over year. August marked the third straight month that job creation in the U.S. slowed. In June, 178,000 jobs were added while 159,000 were created in July.

After four straight weeks, of declines, the major indexes are looking to post consecutive weeks of gains with the S&P 500 gaining +1.8%, the DOW +1.5%, and the NASDAQ will post a weekly increase of +2%. Will we continue to move higher from here or is just a short-term bump?

Key Levels To Watch Next Week:

Continue reading "Market Breaks Out Of Trading Range"

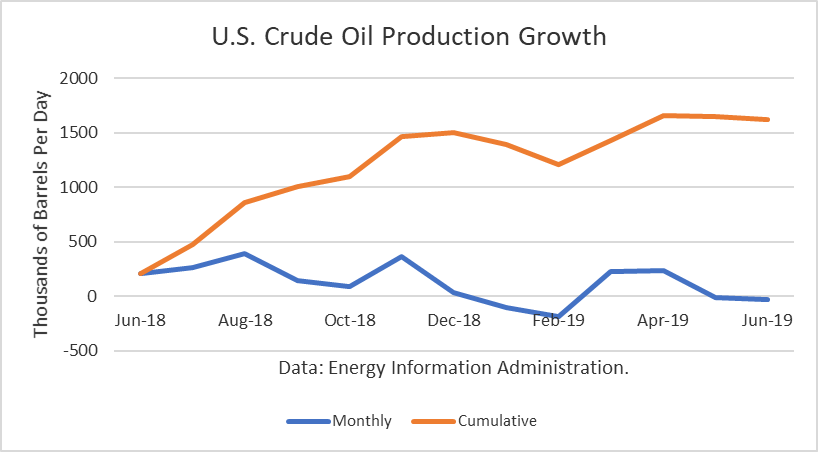
U.S. Crude Production Growth Paused In 1H19

The Energy Information Administration reported that June crude oil production averaged 12.082 million barrels per day (mmbd), down 33,000 b/d from May. The drop resulted from a drop of 58,000 b/d in Oklahoma. Production gained the most in North Dakota (58,000) and Colorado (19,000) while production in Texas was only up 13,000 b/d.

Crude Production

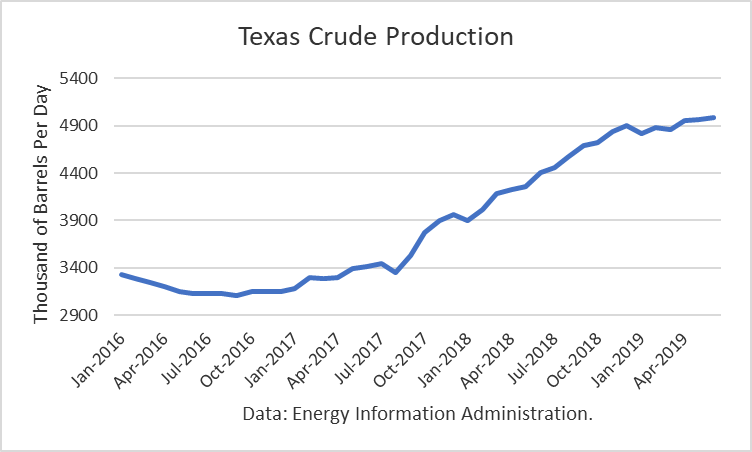
A pause in the growth rate in Texas had been expected due to pipeline constraints, which are expected to be alleviated in the second half of 2019 and first half of 2020. Nevertheless, Texas production reached a new all-time high of 4.982 mmbd.

US Crude Production

The year-over-year gains have been especially impressive with the June figure being 1.410 mmbd. And this number only includes crude oil. Other supplies (liquids) that are part of the petroleum supply add to that. For June, that additional gain is about 540,000 b/d. Continue reading "U.S. Crude Production Growth Paused In 1H19"

Trapped In A Trading Range

Hello traders everywhere. There was no doubt that the market would bounce back today after a losing day on Tuesday, after all, that's the cycle we've been in for a while now. But more importantly, it's the trading range that we're currently stuck in. Not familiar with the term "trading range?"

A trading range occurs when a security trades between consistent high and low prices for a period of time. The top of a security's trading range often provides price resistance, while the bottom of the trading range typically offers price support. In this case, we will be looking at the 50-day and 200-day moving averages. With that definition mind, let's take a look at the major indexes.

All three major indexes, the S&P 500, DOW and NASDAQ, are all stuck in a trading range between the 50-day and 200-day moving averages. This range began almost exactly one month ago on August 5th, where we saw all three indexes lose roughly -3%. The NASDAQ led the way with a daily loss of -3.4% with the S&P 500 and DOW close behind with losses of -2.9%. Since then they have failed to break out above their 50-day MA's, the level of resistance, while the 200-day MA is providing a level of support.

Key Levels To Watch This Week:

Continue reading "Trapped In A Trading Range"

That Precious Fed Independence

Well, what do you know? That precious Federal Reserve independence we keep hearing about turns out to be a crock.

That reality was exposed in the most blatant terms last week when William Dudley, just a year removed from his serving as the president of the Federal Reserve Bank of New York – the second most powerful position on the Fed, just below the chair – argued in a Bloomberg op-ed that the current Fed should do absolutely nothing to try to fix the economy if President Trump is hell-bent on destroying it through his tariff war with China. The Fed, he said, shouldn’t “bail out an administration that keeps making bad choices on trade policy, making it abundantly clear that Trump will own the consequences of his actions.”

But he went well beyond that, urging the Fed to use its monetary policy to help defeat Trump in the 2020 president election.

“There’s even an argument that the election itself falls within the Fed’s purview,” he said. “After all, Trump’s reelection arguably presents a threat to the U.S. and global economy, to the Fed’s independence and its ability to achieve its employment and inflation objectives. If the goal of monetary policy is to achieve the best long-term economic outcome, then Fed officials should consider how their decisions will affect the political outcome in 2020.”

Thank you, Mr. Dudley, for that admission. Some of us have suspected, Continue reading "That Precious Fed Independence"

Macro Implications, As Silver Takes Leadership From Gold

Since we noted the initial move to break the 200 day moving average – and at least temporarily break the downtrend on August 27th – the Silver/Gold ratio (SLV/GLD) has held its breakout, looking to close the week and the month of August on a signal that we have long anticipated.

silver gold ratio

Okay, but the monthly chart of the Silver/Gold ratio makes abundantly clear that nothing has happened that has not happened before during the precious metals bear market. So that is the caveat to a macro thesis that would see a change to inflationary (as led by Silver/Gold), thereby letting commodities of all stripes and many global markets out of the barn. The monthly EMA 30 (grey dotted line) is a reasonable marker for the ratio’s post-2011 containment. The ratio’s price is below that marker. Continue reading "Macro Implications, As Silver Takes Leadership From Gold"