Watch Big Lots, Inc. (NYSE:BIG) Today

Hello traders and MarketClub members everywhere. Just a quick update today on Big Lots, Inc. (NYSE:BIG). Should this stock close at or near its high for the day on Friday, you might want to go home long this stock based on our weekend rule.
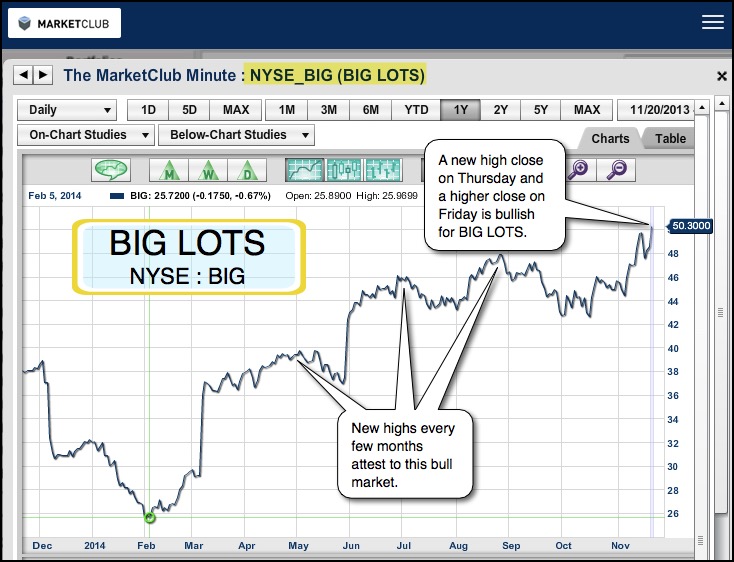
BIG LOTS (NYSE : BIG)

If you are not familiar with "The 52-Week New Highs on Friday" rules, here they are again.

Rule #1: When a stock hits a new 52-week high on a Friday and closes at or close to its high for the day, go home long that stock for the weekend.

Rule #2: Exit this long position on the opening the following Tuesday.

Rule #3: If the stock opens sharply lower on Monday, exit this position immediately.

"The 52-Week New Highs on Friday" rules work extremely well in futures and in Forex.

Be sure to leave your comments below this post and have a great weekend.

Every success with MarketClub,
Adam Hewison
President, INO.com
Co-Creator, MarketClub

The Perfect ETF Portfolio

Hello traders and MarketClub members everywhere! Today, I'm going to be looking at the Perfect ETF Portfolio. This is a very simple portfolio to follow and track and we provide you with all the signals and turning points before they occur.

The Perfect ETF Portfolio was designed to track and take advantage of the major financial markets we have identified as being important in the long run, stocks, gold, the Dollar and crude oil. These four ETF instruments were chosen to give your 401(k) program or retirement program the broadest possible protection, no matter what happens in the world. After all, it is your retirement money and your nest egg, so this is not money you should be gambling with. Continue reading "The Perfect ETF Portfolio"

One Way To Take Advantage Of This Difficult Period

For some time now, I've been talking about the volatility of the markets and for the last three days, volatility has been front and center. So, what is an investor to make of this and what opportunities are there to make money?

One way to take advantage of this difficult period is to look at our Smart Scan technology. In today's graphic, you can see that the market is beginning to tilt more and more to the bearish side of the ledger.

You can see by the Smart Scan numbers, the "Long Term Down" stocks now exceed the "Long Term Up" stocks by almost 400. When you look at "Chart +100", which means there's a strong uptrend, you see just 140 stocks trending upward. The number of stocks trending down in "Chart -100" is over 1000!

There are many stocks that are close to or have just reversed to the downside and you should be either on the sidelines in these stocks or shorting them.

With this being the last day of a tumultuous week, I expect the market to be a little exhausted and do not expect to see a big move either way today. Having just made that statement, I'm going to hedge myself and say as this is Friday, markets can and do sometimes go into turmoil.

This could be a perfect weekend for utilizing the "52-Week rules". In this case, I would favor the "52-Week rules" on the downside of the market. If you are not familiar with the rules for shorting the market, here they are again. Continue reading "One Way To Take Advantage Of This Difficult Period"

How To Trade Like A Billionaire

Wouldn't it be nice if you could look over the shoulder of a billionaire to see exactly what they are doing to make the kind of profits they make?

Well, now you can.

It’s no secret we've had some fantastic moves in 2014. The question is, are they going to continue? The short answer is, some will and some won't. Today I want to share with how five well-known billionaires traded in one particular stock. I am going to put our Trade Triangles to the ultimate test to see how they performed against these billionaire traders.

The five billionaires are Jorge Lemann, Leon Cooperman, Ray Dalio, Daniel Loeb and David Einhorn. We know, thanks to SEC filings, that these five super traders hold positions in the stock of Andarko Petroleum Corp. (NYSE:APC).

I am going to show you about where they entered the market and their average price. I'm also going to show you where our Trade Triangles entered and exited the market. I believe the trend has changed for APC and while these billionaires are holding on, MarketClub's Trade Triangles are signaling a sidelines position.

Based on what we are seeing it is going to be an interesting fourth quarter.

This is where our five Billionaires are positioned right now: Continue reading "How To Trade Like A Billionaire"

Ouch, Yesterday Was An Expensive Day For Many Investors

Has the market topped out?

For the last couple weeks, I have been somewhat skeptical of this market and whether it could keep on moving higher. Yesterday, we witnessed a collapse of several major stocks that were pushing this market higher particularly in the NASDAQ sector.

According to our Trade Triangles, you should get out of the NASDAQ and S&P 500 as they both are showing weekly intermediate-term trends that have turned negative. The DOW is the only index that is holding up so far. The red line for the DOW this week is 16,937 and should the DOW break below that area, it would put all three major indices in an intermediate downtrend.

The following stocks show intermediate downtrends (red weekly Trade Triangles) and unless you are a long-term investor, you should be on the sidelines in these stocks.

Apple Inc. (NASDAQ:AAPL)
Amazon.com Inc. (NASDAQ:AMZN)
eBay Inc. (NASDAQ:EBAY)
Yelp Inc. (NYSE:YELP)
Tesla Motors Inc. (NASDAQ:TSLA)
Netflix Inc. (NASDAQ:NFLX)

To find out if your stock is in trouble, check out the talking chart symbol on the top of every chart. Learn more here.

Now is the time for caution and not bold moves, in my opinion.

Every success with MarketClub,
Adam Hewison
President, INO.com
Co-Creator, MarketClub