Coronavirus - ETFs You Should Avoid

With the deadly Coronavirus outbreak continuing to spread and countless US companies let alone Chinese firms suspend business in China, even though the true extent of that effect is yet to be known, it’s clear there is going to be some economic effect from this disease.

Like it or not, we all live in a world that is becoming increasingly more interconnected and interdependent. This is the same reason a disease like Coronavirus is so quick to spread around the world and why the impact on stocks is not going to be limited to those firms based solely in China.

This makes it even more difficult for investors to truly determine what is safe and what isn’t in the stock market right now. However, we do have some low hanging fruit in terms of what you should not own at this time.

The first Exchange Traded Funds you should be avoiding right now are going to be the pure-play Chinese equity ETFs. The iShares MSCI China ETF (MCHI) or the SPDR S&P China ETF (GXC) should be on your sell list or high on the list of what not to buy. These funds invest in Chinese equities and don’t favor one sector more than others. The longer the ‘quarantine’ periods last in the different provinces in China, the more these ETFs are going to be hurt, end of story. However, these could be two outstanding options if you are looking to buy back into the Chinese markets once the Coronavirus scare dies off.

Furthermore, ETFs such as the Continue reading "Coronavirus - ETFs You Should Avoid"

Worst Performing ETFs in 2019

Earlier in the month, we discussed the Top Performing ETFs of 2019. In this post, we'll discuss the worst performing ETFs of 2019.

After a down year in 2018, the stock market roared back in 2019 despite a number of political headwinds and many market participants calling for a recession to commence during the second half of the year. Fortunately, that never happened and the market shrugged off most of the negative headlines throughout the year since for the most part, economic numbers remained strong and while corporate earnings and revenue growth may be slowing, they are still in positive territory, which is undoubtedly a good sign.

With the S&P 500 (SP500) ending the year up 28.9%, the Dow Jones Industrial Average (DJI) rose 22.3%, and the NASDAQ (COMP) increased by 35.2% in 2019, one may wonder how anyone could have lost money in 2019, but unfortunately, some Exchange Traded Funds and therefore investor, did actually see negative returns during a year when the major indexes all crushed it.

Most investors who ended the year negative may want to forget about what happened. But those investors who focus on understanding why their investments went south are the ones who will learn from their mistakes and hopefully avoid making them in the future. The start of a new year is an excellent time to review your investing thesis and try to pinpoint why some investments didn’t turn out the way you imagined they would. So let’s take a look at the top five worst performing ETFs of 2019 in a number of different categories the average investor had to choose from in 2019 to see if you owned one or more of them.

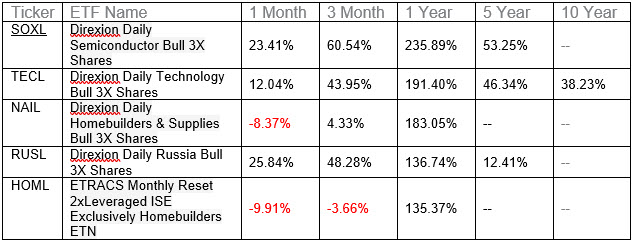
The following table shows the performance of the worst five ETFs in 2019, as well as their performance over the last month, the previous three months, the last five and ten years.

ETFs

The following table shows the performance of the worst five Non-Leveraged ETFs in 2019, as well as their performance over the last month, the previous three months, the last five and ten years. Continue reading "Worst Performing ETFs in 2019"

Top Performing ETFs in 2019

With the S&P 500 (SPX) ending the year up 28.9%, the Dow Jones Industrial Average (DJI) rose 22.3%, and the NASDAQ (IXIC) increased by 35.2% in 2019, much of the year it felt like no matter what you were invested in you were making money. And for the most part, that was true. Some investors made more than others because they had picked what would become the ETF winners of the year.

Did you see market returns, or were you invested in the ETFs that beat the averages and in some cases by a lot? Let’s take a look at the top five best performing ETFs of 2019 in several different categories the average investor has to choose from.

The following table shows the performance of the top five best performing ETFs in 2019, as well as their performance over the last month, the previous three months, the last five and ten years.

ETFs

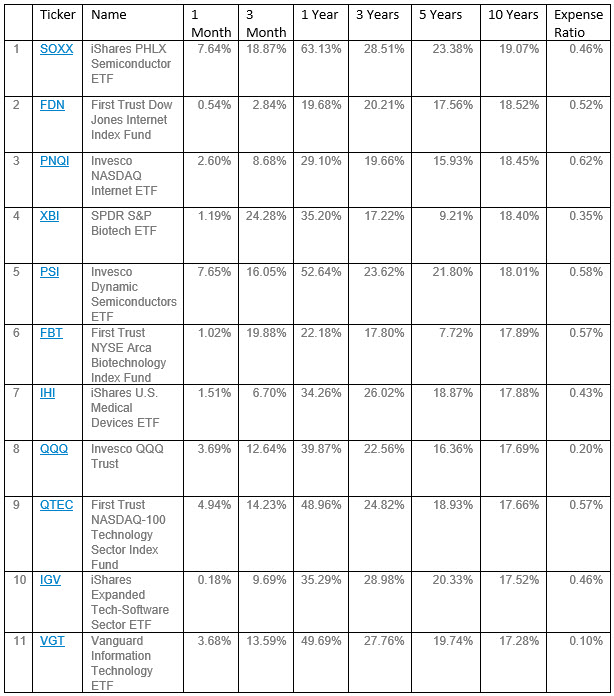
The following table shows the performance of the top five Non-Leveraged ETFs in 2019, as well as their performance over the last month, the previous three months, the last five and ten years.

ETFs

The following table shows the performance of the top five Equity Non-Leveraged ETFs in 2019, as well as their performance over the last month, the last three months, the last five and ten years. Continue reading "Top Performing ETFs in 2019"

Top 25 ETFs To Have Owned Over The Last Decade

The table below is a list of the 25-top performing ETFs over the last ten years. As you will see, the majority of the Exchange Traded Funds on this list produced returns of 15% or more on an annualized basis, with the top ETF returning more than 19% a year on average over the past decade. That would equate to roughly a 250% return before any dividends or fees.

ETFs
Continue reading "Top 25 ETFs To Have Owned Over The Last Decade"

Thankful For Another Great Year On Wall Street

This past Thanksgiving, millions of Americans sat at the dinner table and proclaimed what they were thankful for. For some, it was loved ones, new family members, a promotion at work or a new job altogether, but at the very least, the food that was about to be eaten was mentioned. The success of the stock market in 2019 was undoubtedly one of mine, but I may be in the minority when it comes to people who said such out loud.

However, with the major indexes again trading at new all-time highs, something we have now had occur more than 20 times in 2019, 18 times in 2018, 62 times in 2017 and another 126 times from the start of 2013 until the end of 2016, its hard not to think about how much further this bull market can run.

Adding new money to the market seems very risky today based on how far the market has come the past few years and considering we have seen so many new all-time highs over the past few years.

However, new all-time highs is a very normal thing for the market. Since 1928, the U.S. stock market has seen new all-time highs on 5% of the trading days. Think about that! That’s on average, one in every 20 trading days, the U.S. stock market is hitting an all-time high. From that perspective, a new all-time high sort of seems like not that big of a deal.

Another crazy thought is that since World War II, the U.S. stock market has spent nearly 40% of its time within 5% of all-time highs. Ok, so almost half the time stocks are trading within reach of an all-time high. Furthermore, 54% of the time stocks are trading within 10% of all-time highs.

However, that means 46% of the time stocks were more than double digits below their highs. Continue reading "Thankful For Another Great Year On Wall Street"