Want To Invest In Real Estate?

As an asset class, real estate should be a part of every balanced investment portfolio. That’s because real estate investments generally have a low correlation to stocks, can offer lower risk, and provide greater diversification.

Today about 65% of Americans own a home, but that means that tens of millions of Americans have no exposure to real estate. Making matters worse, becoming a homeowner today is harder than in previous generations, with 1 in 5 millennials believing they will never be able to afford a home. Is there a way to get exposure to the real estate market for as little as $100?

Residential Real Estate Market Trend

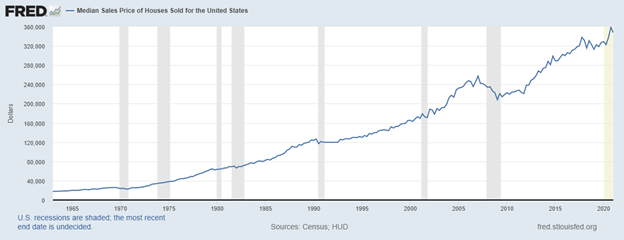
From the chart below, we can see that the residential real estate market continues to climb, and the median price of houses sold in the US is near recent all-time highs of $347,500. Even though mortgage rates remain near all-time lows, the appreciation of prices in certain pockets of the country are making many cities and areas simply unaffordable for most. Things look much the same for industrial, commercial, agricultural, and most other specialized real estate subsectors.
Real Estate

How Can You Invest In Real Estate Through The Stock Market

The stock markets offer three different ways you can invest in real estate, and today we will be looking at three of them: REITs, ETNs, and ETFs. Continue reading "Want To Invest In Real Estate?"

How To Stop Being Scared

The markets really scared a lot of people in the last month. We’ve received lots of emails and comments from people wondering what’s happening in the markets and why the deeper downtrend didn’t prompt new trade triggers. Well, the quick answer is “this downtrend did prompt new BAN strategy trade triggers and this pullback is still quite mild compared to historical examples.” Allow me to explain my thinking.

The recent FOMC meeting, as well as the expiration of the futures contracts, usually prompts some broad market concerns. Many professional traders refuse to trade over the 7+ days near an FOMC meeting – the volatility levels are usually much higher, and this can throw some trading strategies into chaos. Our BAN Trader Pro strategy handles volatility quite well most of the time.

Recently, the BAN Trader Pro strategy initiated new trade triggers of subscribers and myself. Our members are engaged in the best-performing assets for the potential upside price rally that may take place over the next couple of months. Our strategies target opportunities based on proven quantitative technology – not emotions and use proven position management to maximize gains while reducing drawdowns.

Transportation Index Daily Chart Is Bullish

This leading index shows early strength in the market with an upside target of $14,668. That is a 3.5%-4.5% upside move ahead of us.

Recently, we’ve seen some substantial support in the Transportation Index that aligns with our BAN Trader Pro strategy. The rally in the Transportation Index, which usually leads the US economy by at least 2 to 4 months, suggests the markets are actively seeking out a support level/momentum base for another rally phase. Continue reading "How To Stop Being Scared"

Are The Markets Sending A Warning Sign?

After an incredible rally phase that initiated just one day before the US elections in November 2020, we’ve seen certain sectors rally extensively. Are the markets starting to warn us that this rally phase may be stalling? We noticed very early that some of the strongest sectors appear to be moderately weaker on the first day of trading this week. Is it because of Triple-Witching this week (Friday, March 19, 2021)? Or is it because the Treasury Yields continue to move slowly higher? What’s really happening right now, and should traders/investors be cautious?

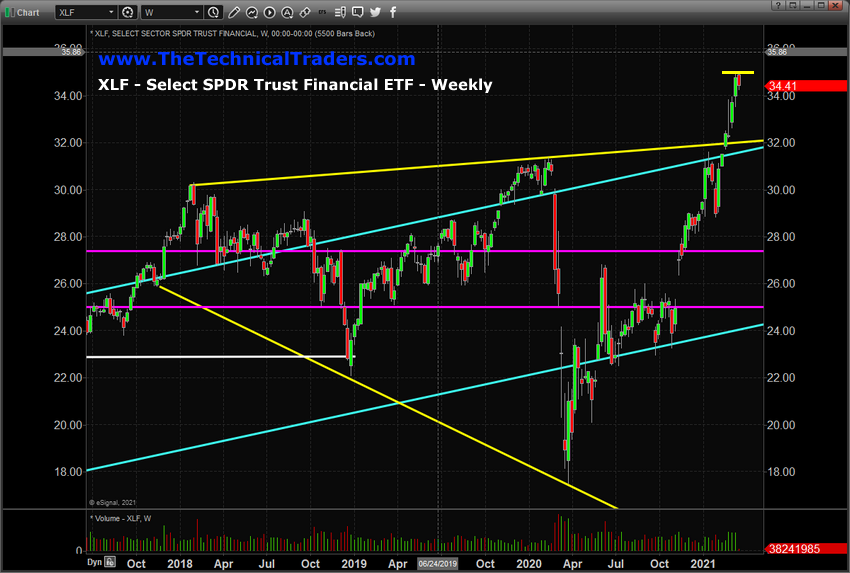
The following XLF Weekly chart shows how the Financial sector rallied above the upper YELLOW price channel, which was set from the 2018 and pre COVID-19 2020 highs. Early 2021 was very good for the financial sector overall; we saw a 40%+ rally in this over just 6 months on expectations that the US economy would transition into a growth phase as the new COVID vaccines are introduced.

We are also concerned about an early TWEEZERS TOP pattern that has set up early this week. If the price continues to move lower as we progress through futures contract expiration week, FOMC, and other data this week, then we may see some strong resistance setting up near $35.25. Have the markets gotten ahead of themselves recently? Could we be setting up for a moderately deeper pullback in price soon?

markets

The following SSO, ProShares S&P 500 ETF Weekly chart, shows a similar setup. Although the rally in the SSO is not quite the same range as the XLF, we see a solid TWEEZERS TOP pattern setup on the SSO chart over a period of many weeks. We also found the moderate weakness in the US indexes interesting this morning. Last week, we continued to see very strong buying trends. Today, we see those trends have almost vanished. Are the markets setting near highs waiting for some announcement or news to push them into a new trend? Continue reading "Are The Markets Sending A Warning Sign?"

Predictive Modeling Suggests A New Gold Rally

One of our readers’ favorite tools is the Adaptive Dynamic Learning (ADL) predictive modeling system. This tool maps out technical and price patterns into an array of similar setups using historical data, then applies that data to current and future price bars. Using the ADL predictive modeling tool, we can see into the future based on historical technical analysis that maps statistically relevant price activity and shows us the highest probability outcomes.

Monthly ADL Gold Predictions

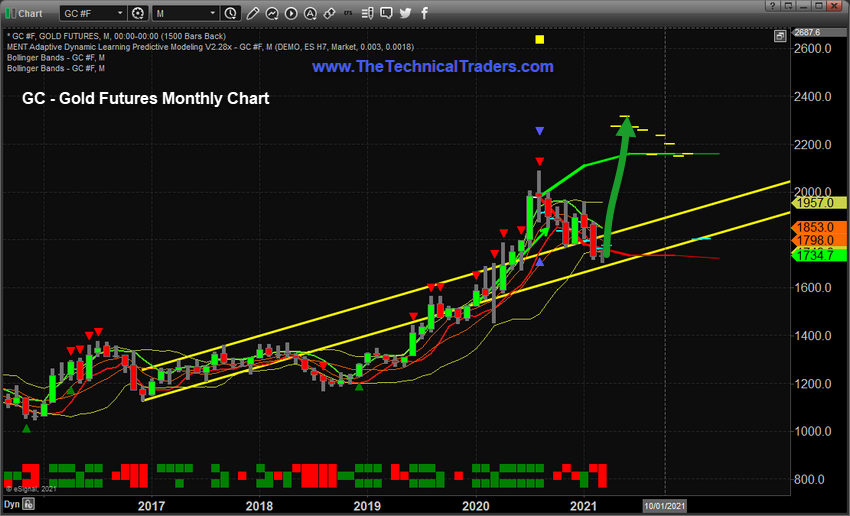
In this research article, we’re going to focus on Gold and how current price action suggests a bottom is likely near the $1720 level. The YELLOW price channels on this Monthly Gold chart highlight exactly where we believe support is located for Gold. If this $1700 price level is breached to the downside, then the previous lows, near $1400, are the next support level for Gold.

Our ADL predictive modeling system suggests the $1720 support level will hold, prompting a new rally to levels above $2200 within 30 to 60+ days. The ADL system predicts an aggressive move in Gold near May or June 2021. The move higher may happen earlier than the ADL Monthly predictions indicate. There is a chance that a move back above $1850 starts the move higher before the end of March or April 2021 – propelling Gold toward the $2300+ peak. The actual peak level predicted by the ADL predictive modeling system is $2315.

predictive modeling

2-Week ADL Predicts Gold May Start To Rally Near Mid-March

This 2-Week Gold Chart highlights a similar ADL price prediction. What we find interesting about this ADL predictive modeling outcome is the similar price predictions originating from vastly different origination points. The Monthly ADL prediction originates from a date of August 1, 2020 – the peak price bar. This 2-Week ADL prediction originates from a date of November 23, 2020 – the intermediate low DOJI bar before the recent continue downward trend targeting the YELLOW price channel. Continue reading "Predictive Modeling Suggests A New Gold Rally"

Bonds And Stimulus Are Driving Big Sector Trends

Falling Bonds and rising yields are creating a condition in the global markets where capital is shifting away from Technology, Communication Services and Discretionary stocks have suddenly fallen out of favor, and Financials, Energy, Real Estate, and Metals/Miners are gaining strength. The rise in yields presents an opportunity for Banks and Lenders to profit from increased yield rates. In addition, historically low-interest rates have pushed the Real Estate sector, including commodities towards new highs.

We also note Miners and Metals have shown strong support recently as the US Dollar and Bonds continue to collapse. The way the markets are shifting right now is suggesting that we may be close to a technology peak, similar to the DOT COM peak, where capital rushes away from recently high-flying technology firms into other sectors (such as Banks, Financials, Real Estate, and Energy).

The deep dive in Bonds and the US Dollar aligns with the research we conducted near the end of 2020, which suggested a market peak may set up in late February. We also suggested the markets may continue to trade in a sideways (rounded top) type of structure until late March or early April 2021. Our tools and research help us to make these predictions nearly 4 to 5+ months before the markets attempt to make these moves.

If our research is correct, we may have started a “capital shift” process in mid-February where declining Bonds, rising yields, and the declining US Dollar push traders to re-evaluate continued profit potential in the hottest sectors over the past 6 to 12+ months. This would mean that Technology, Healthcare, Comm Services, and Discretionary sectors may suddenly find themselves on the “not so hot” list soon. Continue reading "Bonds And Stimulus Are Driving Big Sector Trends"