Is Zillow's Collapse A Warning Sign?

Watching Zillow (ZG) move from over $200 per share to recent levels below $90, reflecting a more than 55% collapse in price, while the housing market continues to rally may be an indication that traders/investors have already discounted the future peak in the U.S. capital markets and Real Estate assets related to the current market environment. Zillow is not the only symbol experiencing this broad price decline. Redfin (RDFN) has also declined more than 54% over the past 7+ months.

Is the peak in real estate flippers prices sending a strong warning for traders/investors?

The peak in these stocks happened near February 16-22, 2021. This date, interestingly enough, aligns with a peak in global capital markets using my proprietary Smart Cash Index and a very clear peak in the Chinese Hang Seng Index.

Recent news that Zillow halted the purchases of homes using its "Zestimate" and Ibuyer programs, which act as a purchase, renovate, flip-type of market service allowing home sellers to get an almost instant purchase offer from Zillow has raised questions in my mind related to the potential risks involved in owning large quantities of real estate assets in a shifting market.

This news article suggests Zillow has over 2800 US homes available for sale. We are not aware of how many homes have been purchased and are waiting for completed repairs/inspections before they go on the market, but Zillow sold 5,337 homes in 2020, up from 4,313 in 2019. Continue reading "Is Zillow's Collapse A Warning Sign?"

$4550 Is Critical Resistance For The S&P 500

Two main factors are driving the rally in the US stock markets recently; retail traders buying the dip, and Q3:2021 earnings data is starting to shake away the concerns that resulted in the recent market rotation. Combine these activities with the start of the Christmas Rally phase (which usually starts sometime after mid/late-October and carries through into early January), and we have the making of a moderately strong potential price rally in the US major indexes over the next 60+ days.

The $4550 Level Is Critical Resistance For The S&P 500

I’m highlighting this ES Daily and Weekly chart pattern, below, to share with you how important it is to see the ES break above the $4550 level – the past high price peak. If the markets are going to start a new rally headed into the 2021 Christmas season, then we need to see the ES continue to rally and break above the $4550 level. It is critically important that price breach the $4550 level and attempt a strong move higher if this bullish momentum persists.

The ES has already broken above three previous Stand-out Highs, drawn in MAGENTA. This shows the strength of a bullish price advance and building bullish price momentum. Yet, the final price high, near $4550, is critically important from a technical standpoint. Continue reading "$4550 Is Critical Resistance For The S&P 500"

Real Estate ETFs React To Rising Mortgage Rates - Part 2

As the Real Estate market shifts away from super-low interest rates and skyrocketing home prices throughout the COVID-19 crisis, we are starting to see the Real Estate ETFs weaken in trend and start to move lower. The recent rising Mortgage Rates will likely continue to weaken sales trends and push home prices a bit lower over the next few months. The Real Estate ETF, IYR, is already reflecting a roughly 10% decline in valuation since early September 2021.

In the first part of this research article, I shared a historical chart of the US Average Mortgage rate and some data suggesting the average US consumer is somewhat bound to certain home price constraints based on Average Income. Typically, mortgage payments should stay below 50% of the borrower’s total take-home income. Depending on the borrower and the home price, many US borrowers may already be priced out of the market – even with 3.25% interest rates.

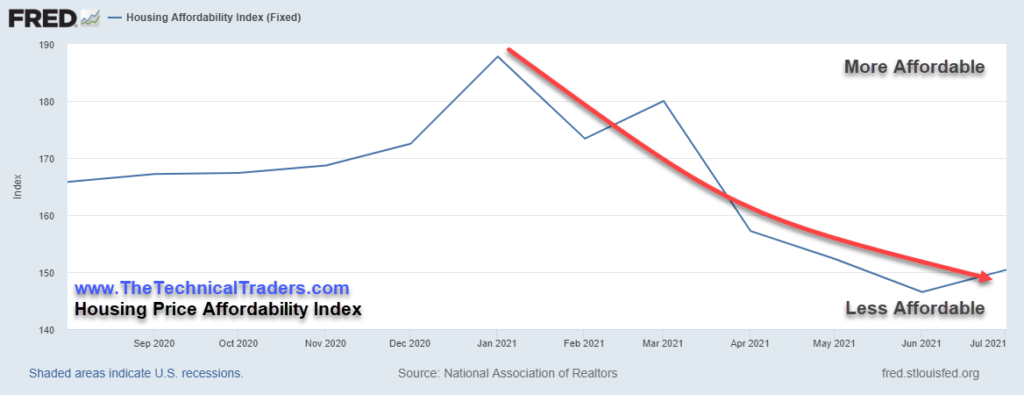
Peak Home Price Affordability Was Reached In Early 2021

Peak affordability appears to have peaked in December 2020 & January 2021 – just after the COVID-19 crisis. This likely correlates to the lower interest rates, at one point below 2% in most of the US, for home buyers while home prices were 20% to 40% lower than they currently are in most areas.

Housing - Home Sales

(Source)

Case/Shiller National Home Price Index Has Skyrocketed 30% Higher Since May 2020

A great measure of the National Average Home Price is the Case/Shiller US National Home Price Average Index. From the chart below, you can see the almost parabolic rise in home prices after the March 2020 COVID-19 event. This incredible rally represents a 30%+ increase in home average US home prices in a little over 13 months. Continue reading "Real Estate ETFs React To Rising Mortgage Rates - Part 2"

Real Estate ETFs React To Rising Mortgage Rates - Part 1

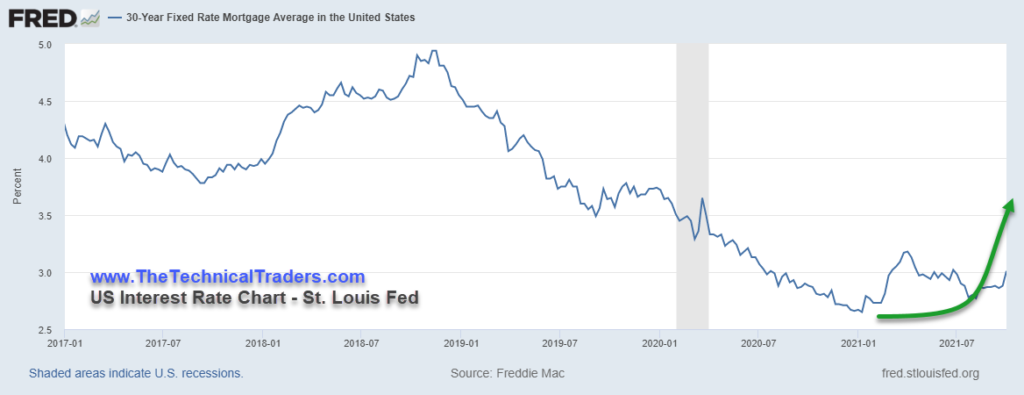
US Mortgage Rates have risen from levels near 2% to 2.25% earlier in 2021 to levels now above 3%. This increase in the cost of borrowing money for home purchases has a downward effect on home prices and sales. The affordability of homes is directly related to the sales price and the cost of the mortgage to secure the purchase of the home. As interest rates rise, home affordability becomes less attractive and feasible for many potential buyers, and home prices start to fall in an attempt to allow a quicker sale.

The Making of Another US/Global Housing Crisis

The easiest way to think about this is to consider the ability of buyers to secure and satisfy mortgage payments for homes. The more expensive the sales price of the home and the interest rate of the loan is, the more likely the affordability of the home is going to be perceived as undesirable.

As concerns related to the US economy, and the indication by the US Federal Reserve that rates will likely start to increase before the end of 2021 or very early in 2022, mortgage rates have already increased by nearly 45% over the past 60 days. A $500k home would have cost about $2500 a month at a 2.25% mortgage rate (including property taxes, homeowners insurance, mortgage insurance, and principal & interest). That same $500k home costs more than $2700 a month at a 3.25% interest rate (including all fees and costs).

US Interest Rate Chart - Home Buying

Over the lifetime of the loan, the total costs of buying the $500k home have now increased by more than $70k for the buyer. If rates rise to 4.25%, the new monthly cost of that same $500k home rises to nearly $3000 per month. Raising the total cost of buying that $500k home by more than $180k over the lifetime of the loan for the new buyer. Continue reading "Real Estate ETFs React To Rising Mortgage Rates - Part 1"

Transportation Index Continues To Grind Higher

If the face of last week’s sideways price action and almost in a rebellious manner today (May 4, 2021), the Transportation Index is moving higher while the US major indexes are all broadly lower. VIX has shot up over 20 again (over +13% higher) and the NASDAQ is off by more than 300 points (-2.75%) as I write this article. Yet, the Transportation Index is bucking the trends and trading higher.

What does it mean when the Transportation Index bucks the major index trends?

My team and I have often highlighted the Transportation Index in our past research article. The reason we watch this index so closely is that it tends to lead market trends by at least 30 to 60 days. In short, the Transportation Index is a measure of future expectations related to freight, shipping, transportation, and the movement of goods and commodities across the US and across the globe.

When an economy contracts, the Transportation Index will likely follow major indexes lower as future expectations related to economic activity contract. When a recession or deep price correction happens, the Transportation Index usually moves sharply lower as the sudden shock of an unexpected economic contagion vastly alters future economic expectations. But generally, the Transportation Index tends to front-run economic expectations. Continue reading "Transportation Index Continues To Grind Higher"